
The Power of Analogy
How Classification Helps Us See the World More Clearly

Why I didn’t eat bananas as a kid
Unlike the majority of today’s ‘revolutionaries’ who adorn themselves with Che Guevara t-shirts and curse at the ‘evils of capitalism’, I spent my childhood living in a communist society.
And let me tell you, it ain’t pretty.
The ideals of unity and equality screaming from the billboards and government-run TV programs have not resulted in a wealthy and comfortable society; quite the contrary, we lacked most things kids in non-communist societies enjoyed without a thought.
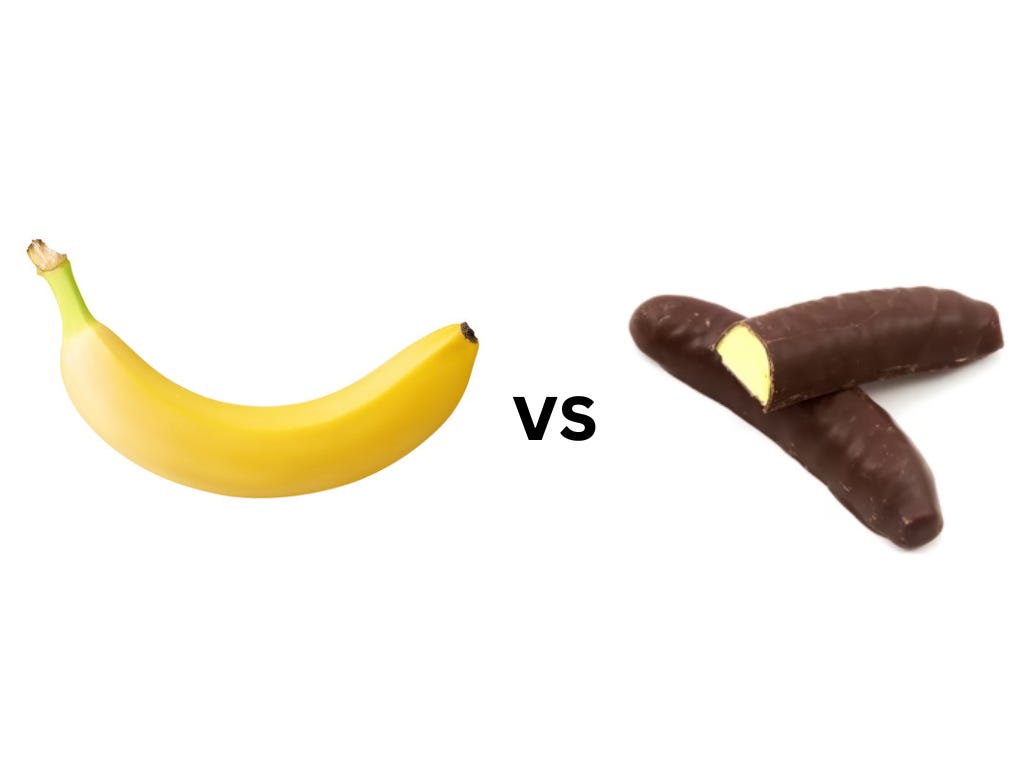
Like bananas, for example.
I’ll never forget my daily disappointments in asking for bananas in my neighborhood grocery store, only to get a negative answer and a sad replacement: a sorbitol-rich chocolate banana that did wonders for my bowel dynamic.
One of the main tenets of communism is the ideal of a ‘classless society’: a society without significant socio-economic differences between people. A place of fairytales and ridiculous mismanagement of society’s wealth.
Beneath this idea lay a presumption that extending a natural tendency for things to separate into different groups to people was somehow bad. It took quite a lot of imagination (or perhaps, delusion) not to realize that classes are everywhere. Everything we see and experience can be classified somehow. Yes, this includes people too. Grouping things into different piles is a normal way for humans to make sense of the diversity of the world and preserve energy for other tasks.
In this lesson, we are not going to talk politics. Instead, we will investigate the concept of classes and classification. What is it, how to use it properly, and how to make classification work for us, rather than against us?
Note on terminology
Quick note: there are several terms that are equivalent in meaning here. Classes, categories, groups, and sets will all refer to the same thing. Likewise, classification and categorization will refer to the same process of creating and thinking with groups of things.
How to classify like a boss
As you’ve figured out by now, I like to go back to the basics and start simple.
Real simple.
In this case, we have to start by understanding the main concepts in a field of math and logic called the set theory.
You have probably learned this in school, but in case you’ve forgotten it, let’s review some basic definitions.
The word ‘set’ refers to a collection of distinct objects. These objects are called ‘elements’ or ‘members’ of the set.
The simplest example would be a set of fruits, like this:
In set theory, the curly braces { and } are used to express the boundaries of a set. In a set, the order of the elements doesn’t matter.
Sets are logical concepts that give us a way to categorize information. A set is like a package that contains some collection of things that are similar to one another in some way.
Sets are a logical mechanism behind classification. Making sets is useful in many ways. It helps us organize information. Instead of listing all possible fruits by name, using a set ‘fruits’ allows us to simplify mental operations and preserve our thinking energy for other tasks. It is very similar to the computer program that compresses a bunch of files in a single folder, to save space on our disk.
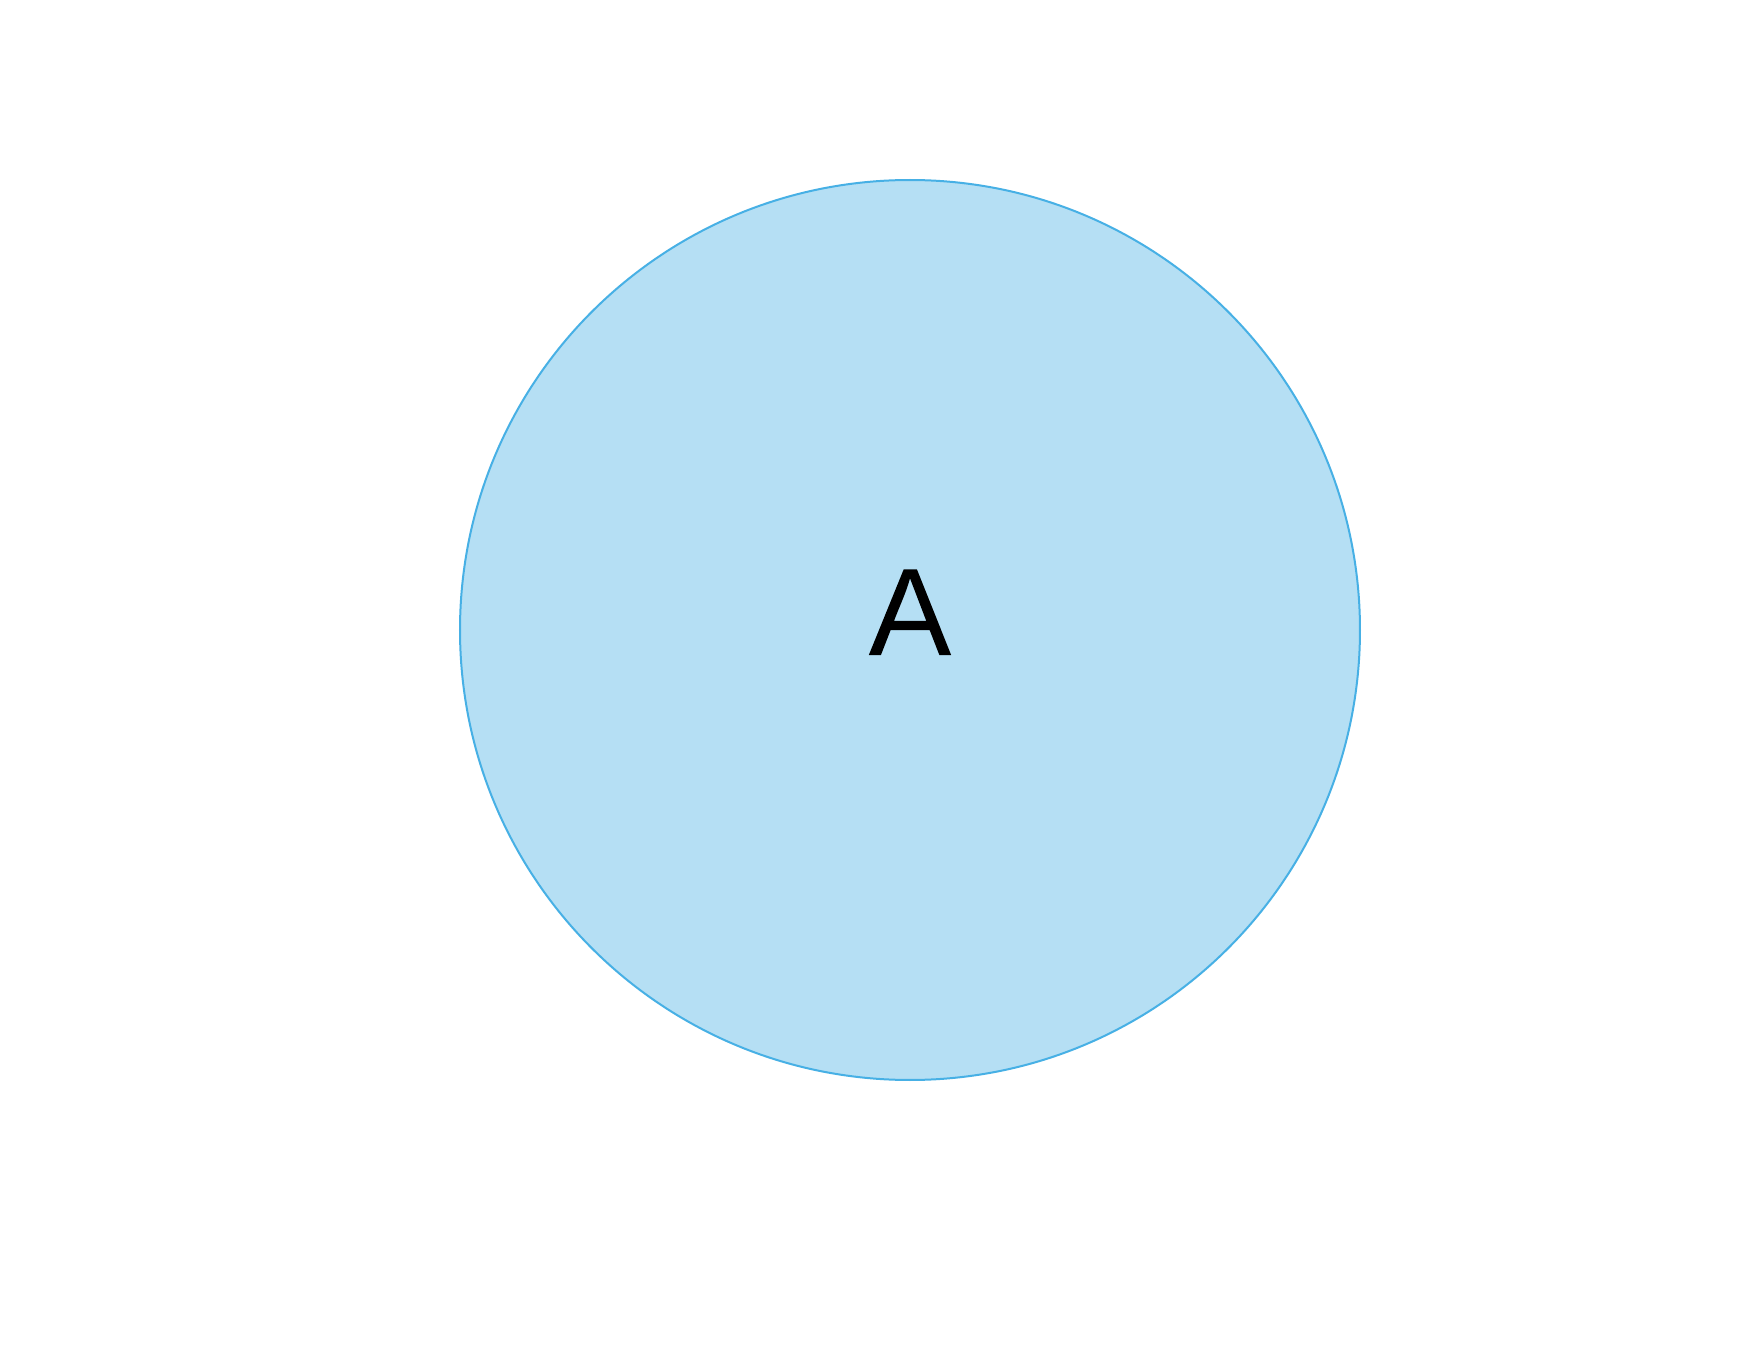
A good way to represents sets visually is by using Venn diagrams. A single set (let’s call it set A) is represented by a circle, like this:
Of course, we can add more sets to the picture. We can model any situation that requires classification with sets and add as many sets as required.
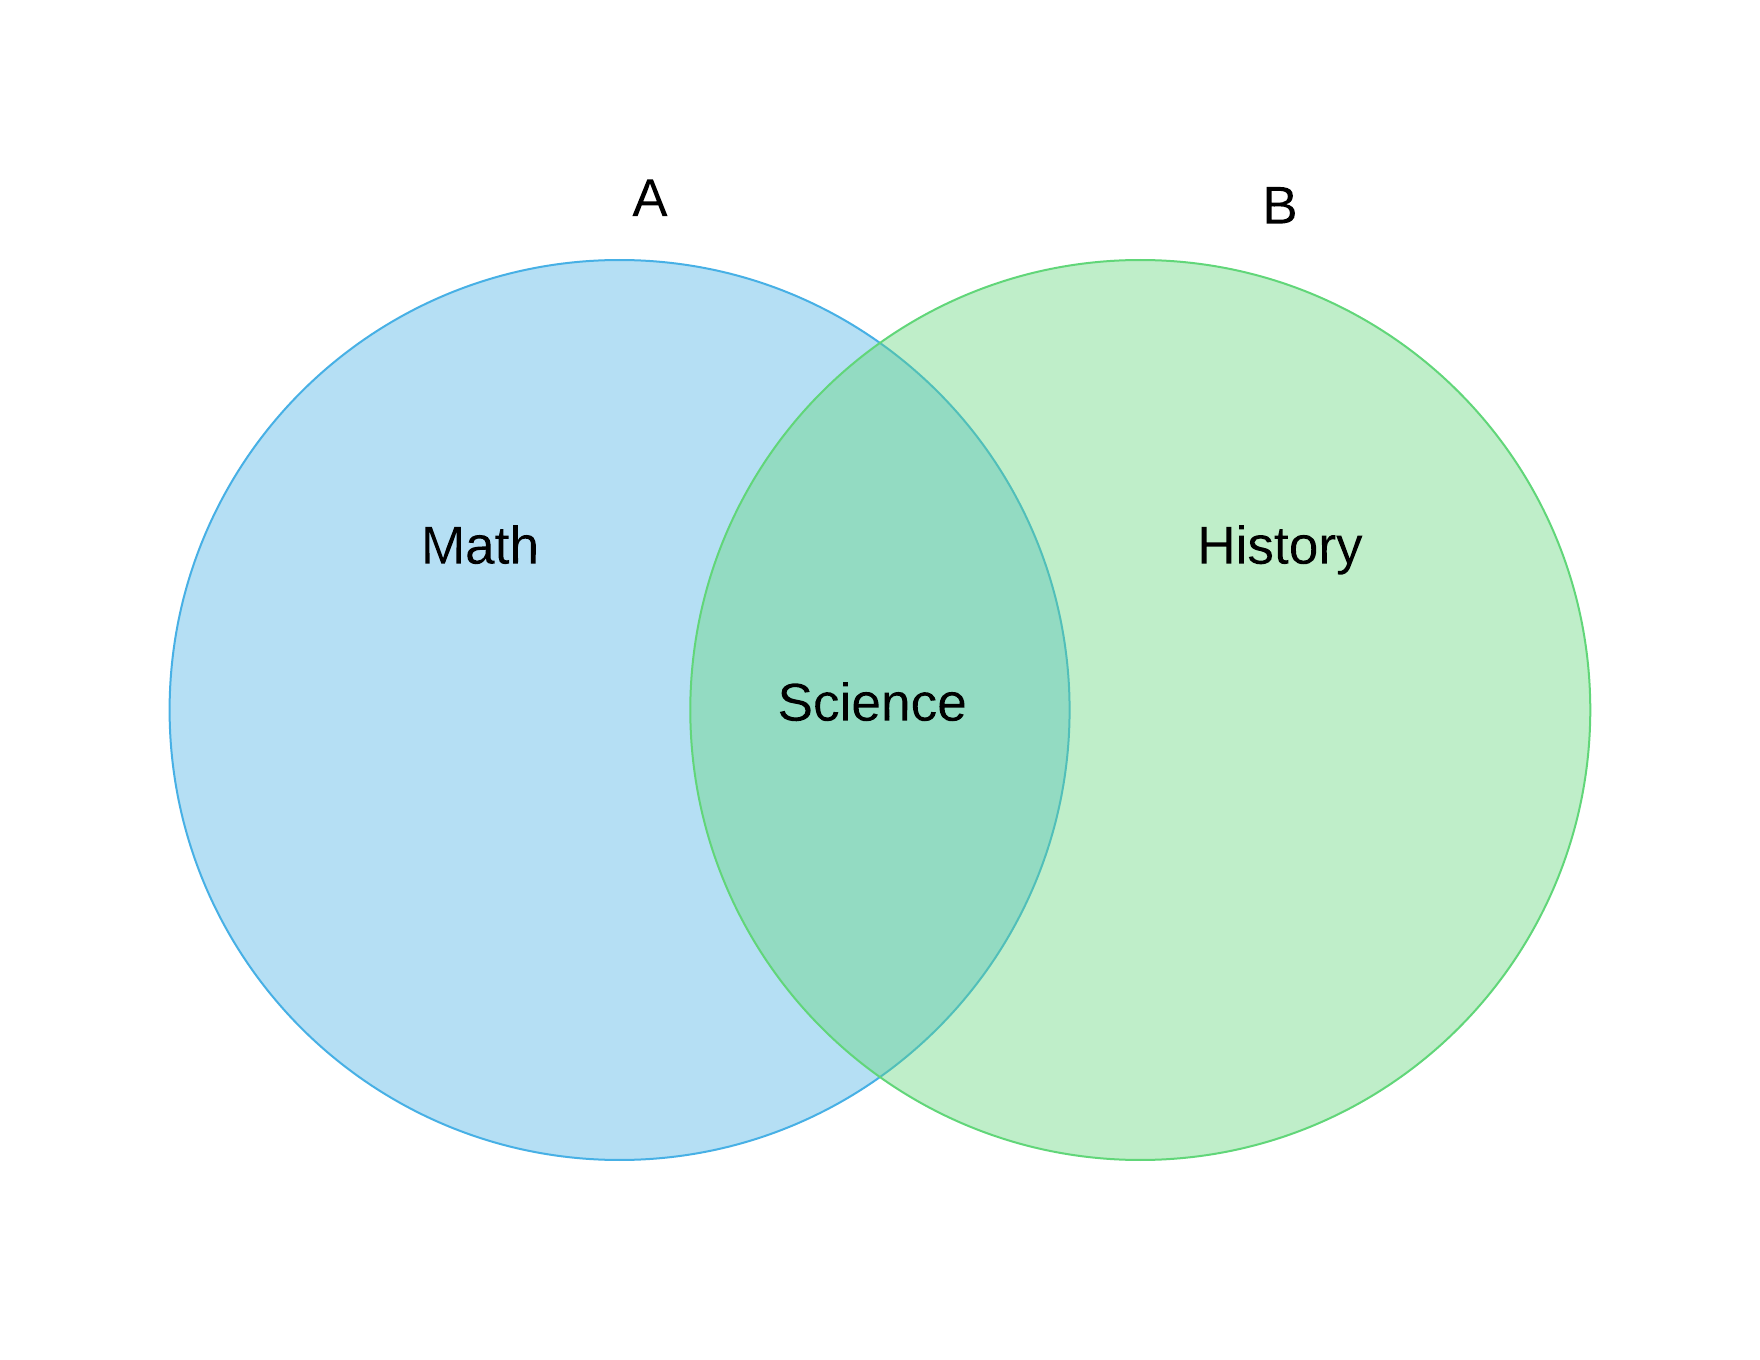
Let’s imagine we have two friends, Anne and Bob, who are college students. If we use sets to represent the courses each of them take this semester, we can do it like this:
This is a visual representation of the following two sets:
and
Sets give us an ordered way to represent how the two classes relate. With this graph, we’re creating a model in which Anne takes Math and Science, and Bob takes History and Science courses.
As you can easily see, these sets have one element in common.
Set theory is productive and has an arithmetic of its own. This means that we can use some kinds of arithmetical operations on the existing sets to generate more information from them. First, we can make a union of the two, which would include all elements in both sets. We can use a simple algebraical expression:
where, U is the union set.
In set theory, we express this using the union symbol, a wide letter U:
How do we calculate A + B here? Well, we can simply sum up all the courses both Anne and Bob are taking this semester. So, Anne takes Math and Science, and Bob takes History and Science, so is it like this?
I am sure you can see the problem here. Science is counted twice.
Why is this so?
It is because these two sets intersect: as we’ve seen earlier they have one element in common. The intersection is visible as an overlap in the Venn diagram. We can think of this intersection as a separate set, which we can call I.
In set theory, we flip the union symbol upside down to get the intersection symbol:
So, this is a set with just one element:
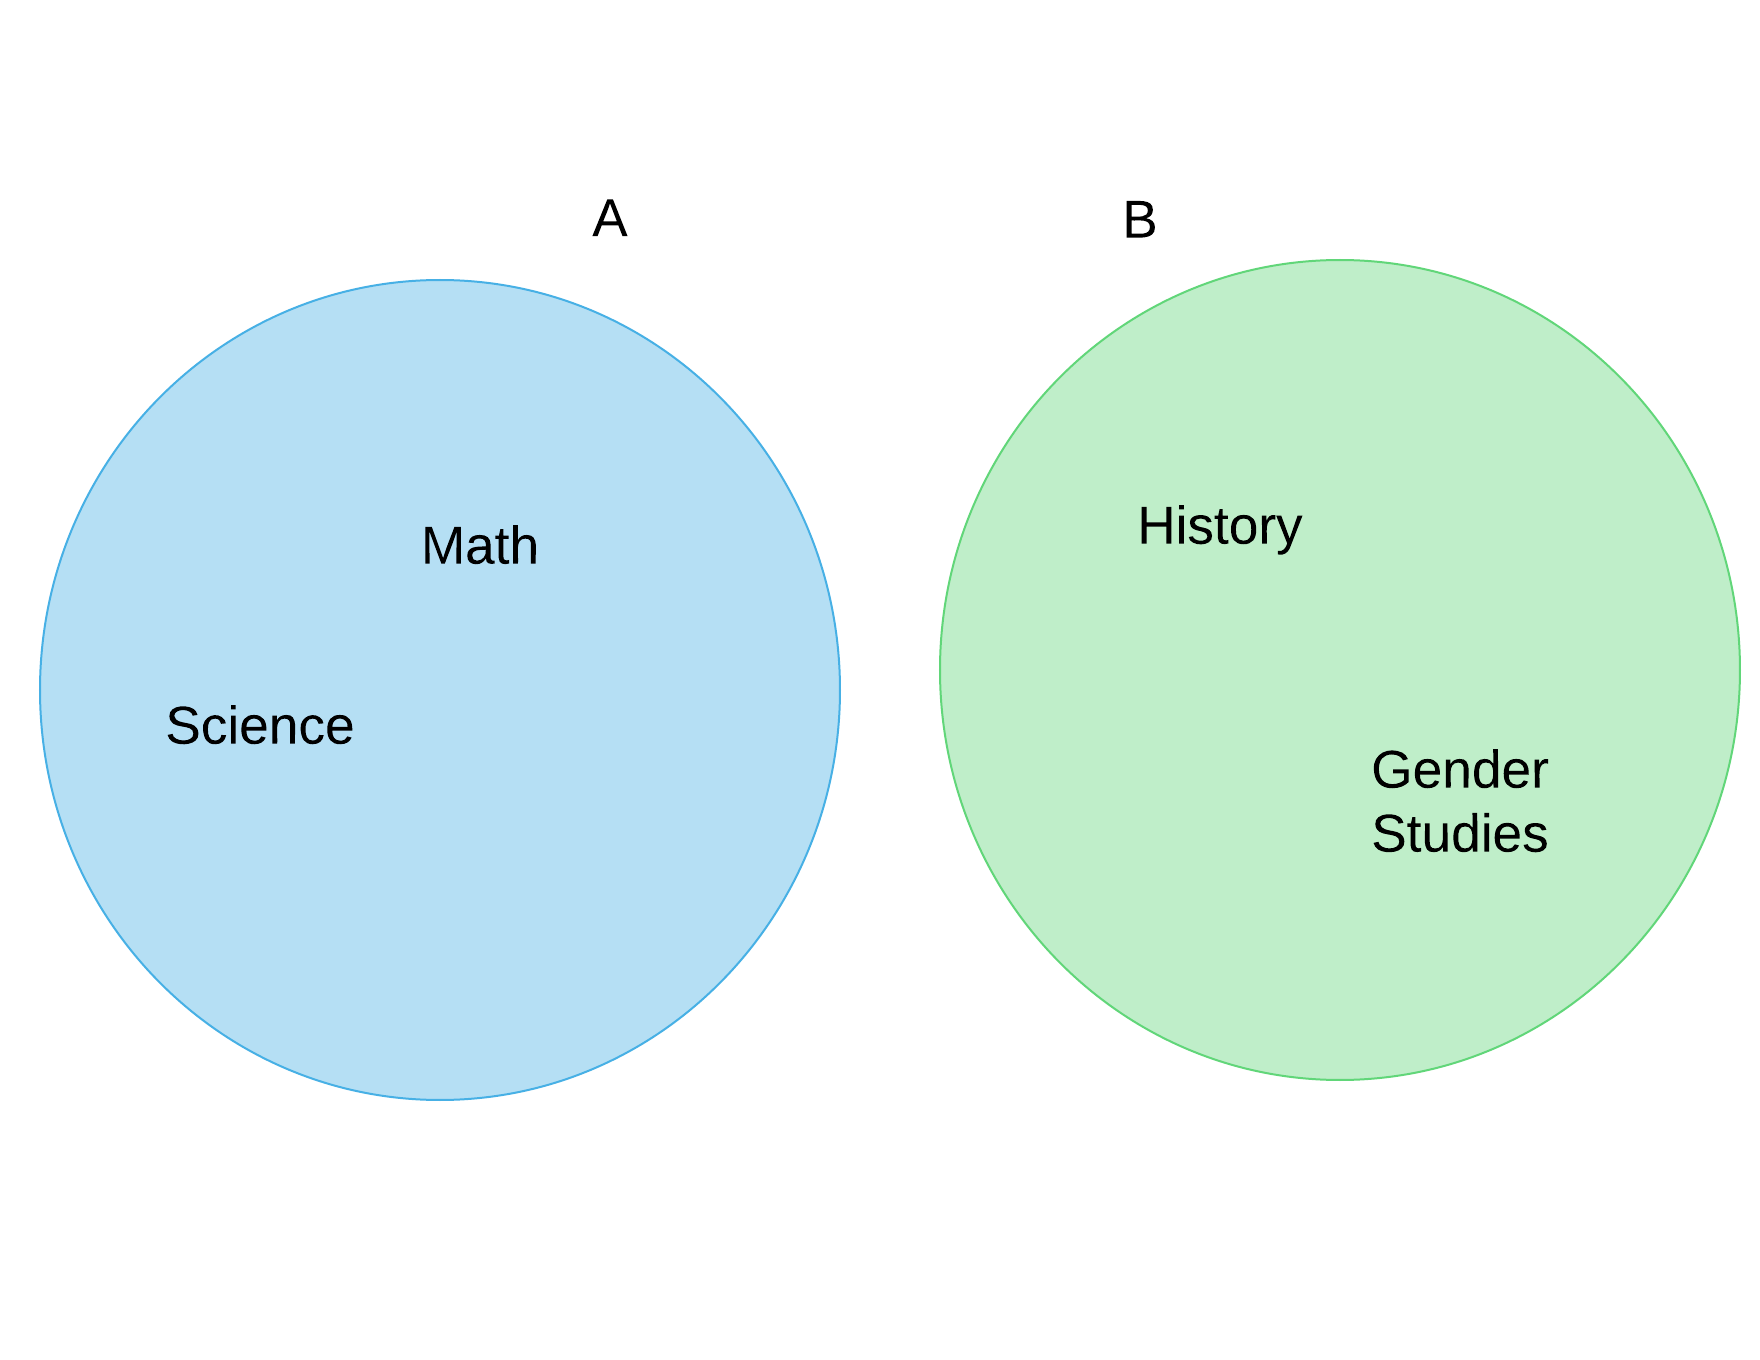
Sets can also have no elements. If Anne and Bob did not have any common courses this semester, it would look like this:
We can express this in set theory like this:
or
where the crossed circle denotes an empty set.
So, since the set I in the original scenario where Anne and Bob do have one course in common is not empty (it includes Science), we can express the union of two such sets like this":1
In other words, since there is overlap, we don’t want to count some elements twice. Here, we have to subtract ‘Science’ once in order to get the proper union that looks like this:
Exercise 1: How would you compute the union if we had three sets, where there's another student called Claire, who takes Music and Science? Draw a diagram and write what formula would give us the correct union set. We can use sets to further investigate the concept of class membership. For example, we can also have subsets and supersets.
Subsets are smaller sets that are contained within some larger sets. For example, imagine a larger set of college courses, and within it a smaller set of first-year, or freshman courses.
Visually, it looks something like this:
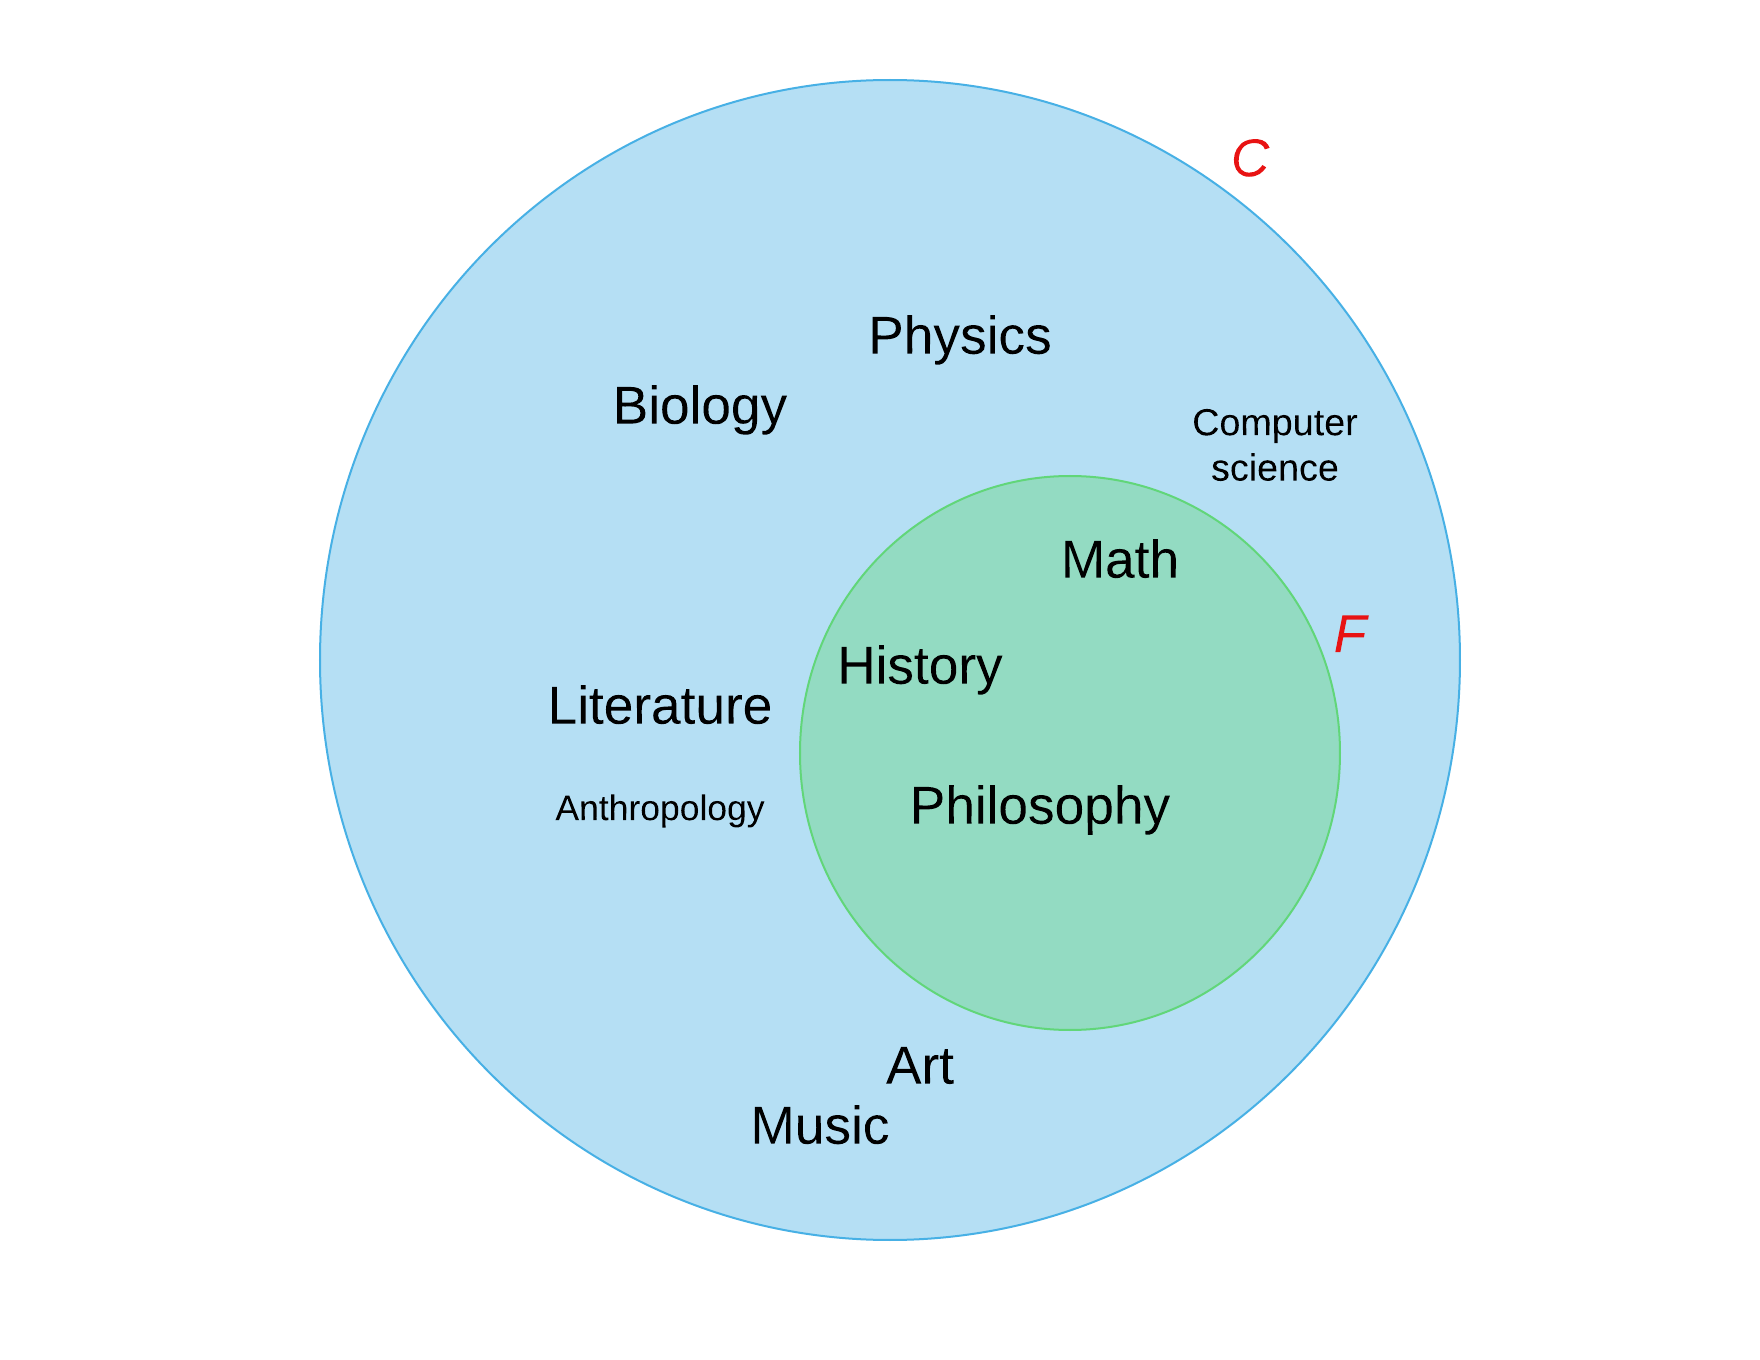
In this case, the set F is a (proper)2 subset of the set C. The subset criterion (the rationale behind making the subset) is freshman courses.
Now, think about some other ways we could make subsets within the set F. What are other possible ways to classify these courses?
Here’s one:
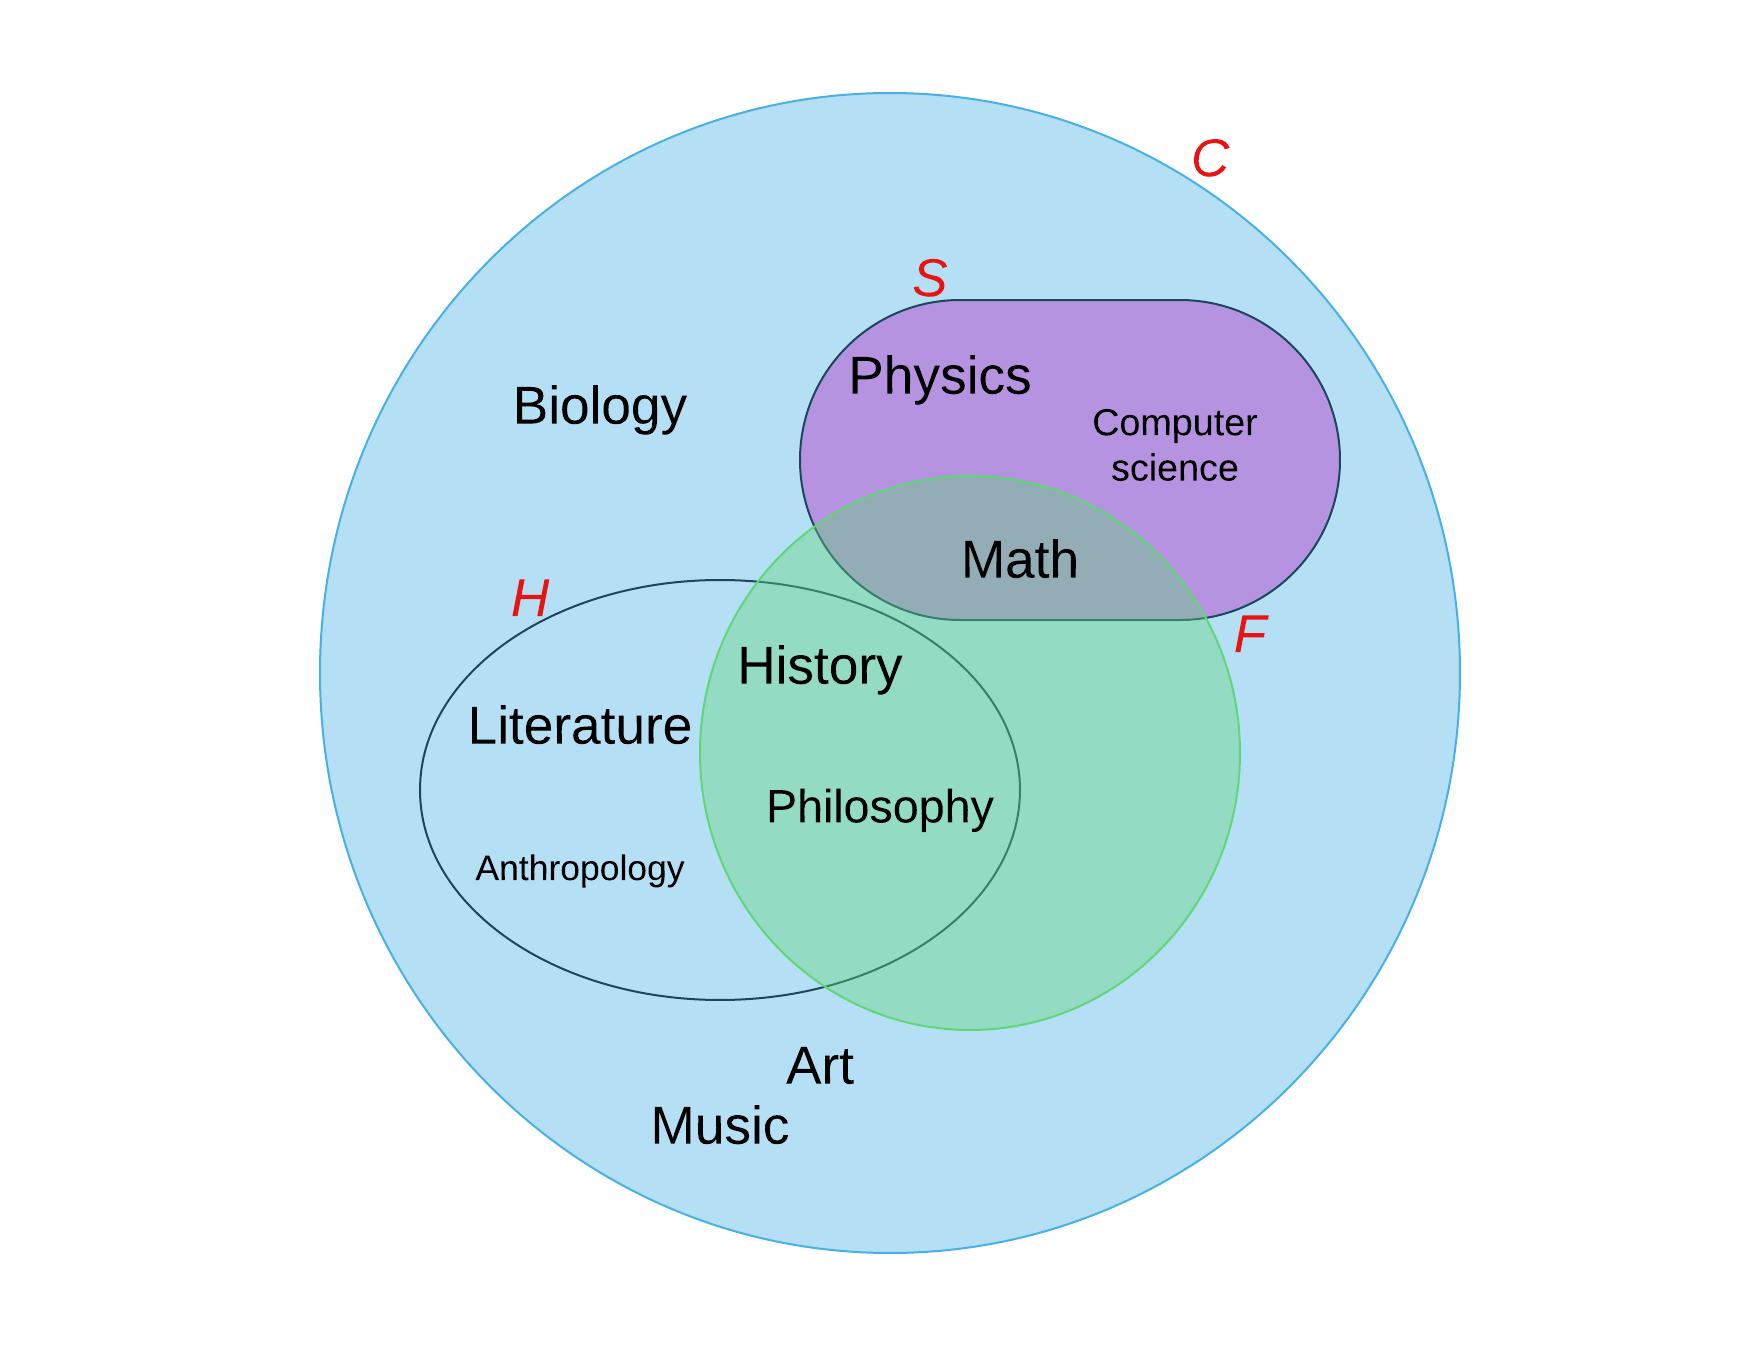
Exercise 2: What is the criterion in subset creation in the previous picture for subsets H and S? Make another possible subset of courses and identify the criterion.
Supersets are those larger sets that contain the smaller ones. Here, C is a superset, containing F, H, and S as its subsets.
How set theory can drive you crazy
The funny aspect of set theory comes from the fact that we can apply set theory to itself. For example, we can say that there is a universal set, which contains all possible sets out there.
We can also make a set of all subsets of some set. In our course example, F, H, and S are all subsets of C, and we can think of them as some separate set R. So, R is a set of all subsets of C.
When we make subsets, we have to be able to tell what makes them separate sets; that is, what makes them special enough to belong to some subgroup of the larger group. In the last graph, the subsets were defined by the academic similarity of courses, with humanities and sciences separated into different subsets.
We have absolute freedom to define sets as we please, as long as we’re consistent and can define set membership with some ease. For example, we can say that a set can be a member of itself. Imagine some set S that has itself as a member.
We can express it like this:
If you’re struggling to understand how is this possible, think of the example of the universal set a bit more: since a set is any collection of things, we can have a set that is a collection of all sets. Since a set that contains all sets is also a set, then it is a member of itself.
It would look something like this:
Set theory is a type of logic, and in logic, we can easily define opposites: things that are completely different. If we have sets that are members of themselves, then we must have sets that are not members of themselves.
This is much easier to understand. A set of bicycles, for example, is not a member of itself because it contains only bicycles, not sets.
But, set theory defined like this holds a dark secret that can drive you crazy.
To see this dark secret in a practical example, imagine two sets: set A containing all barbers who shave only those men who don’t shave themselves; and set B containing all men who do not shave themselves.
So, the hairy question is this: if we imagine some particular barber, which set he belongs to, set A or set B?
Let’s explore the options.
If the barber shaves himself:
By definition, he cannot belong to set B (since set B contains men who do not shave themselves).
Therefore, he must belong to set A (barbers who shave only those men who do not shave themselves).
However, if he belongs to set A, he must only shave men who do not shave themselves. Since he shaves himself, this contradicts the definition of set A. Thus, this scenario leads to a contradiction.
If the barber does not shave himself:
By definition, he belongs to set B (since set B contains men who do not shave themselves).
Therefore, he must be one of the men who the barber (himself) shaves.
However, if he is in set B, then he should be shaved by himself, which means he shaves himself. This again leads to a contradiction.
Therefore, the barber cannot consistently belong to either set.
There is no way out.
This is the famous Russell’s Paradox, named after the famous British philosopher, Bertrand Russell, which led to an interesting crisis in logic and mathematics in the beginning of the 20th Century.
Exercise 3: What would you change in how set theory is established to avoid Russell's Paradox? Come up with one rule that would prevent its occurrence.
The problem stems from the unrestricted self-reference in defining some sets. Expressed more formally, the paradox is born because we’re trying to define a set S as the set of all sets that do not contain themselves. So, when we ask whether set S is a member of itself, we get into a situation in which if it is a member of itself, then it is not a member of itself, or if it is not a member of itself, then it is.
A recipe to go nuts.
As you will learn in one of the following lessons, self-reference is a tricky thing, and can expose important limitations in our thinking. But, we’re not going to go down that road yet because we have more important things to ponder first.
In particular, we must investigate the question of set membership criteria. Namely, if sets are useful to classify and categorize things, how do we determine what belongs to which set, and how do we draw the lines between them?
Ask your neighbors
Set theory gives a good foundation for understanding the basics of classification and provides us with a logic for thinking about groups of things and their relations. But, it is limited in a practical sense because sometimes we struggle to identify which set things should belong to.
This practical problem stems from the fact that the world is not neatly pre-packaged for our consumption. Classes and sets are artificial concepts we come up with to ease our reasoning, and the world doesn’t always cooperate. Uncertainty rules outside of the realm of logic, and we need to find ways to reconcile the unruly world with the demands of ordered and organized thinking.
Here’s the best example. Are you familiar with the animal pictured below?

In case you are not, this is a platypus, a semi-aquatic creature with confusing characteristics. First, it has fur and produces milk, as all mammals do. Second, it lays eggs, as birds and reptiles do. Third, it has a beak and webbed feet like a duck.
So, what the hell is this thing? How should we classify it?
You may not be surprised to learn that it comes from Australia, a land down under that pokes a hole in our efforts to classify things as neatly as possible.
When we try to classify things in real life, we face these kinds of examples. Objects in reality, be they rocks, animals, or people, don’t really fit neatly into theoretical concepts like sets that we created for them. There is a lot of uncertainty that stems from the fact that features are shared; one object can have two or more features considered central to different classes. Platypus is a great example.
So, how can we still use classification to organize our thinking around groups of things and their elements?
One very interesting concept comes from the field of machine learning, and it is called K-Nearest Neighbors (KNN for short). It is a very interesting algorithm that classifies things using the concept of analogy. Namely, it uses similarity between items to assign them to different sets.
The idea is very simple: to determine the category of a new item, we look at the closest examples we already know and see what category these examples belong to.
Here’s an example.
Imagine you are at a fruit market and you come across an unknown fruit, something you’ve never seen before. You want to classify this fruit as either an apple or an orange. The KNN method uses four steps to guide you in this process:
Identify features. First, you look at the features (characteristics) of the new fruit. You consider things like size, shape, and color.
Compare with known items. Next, you compare these features with those of fruits you already know are apples or oranges.
Determine nearest neighbors. Then, you find k fruits (where k is a variable number that you choose) that are most similar to your unknown fruit in features you selected in step 1. Let’s choose k = 3 for simplicity.
Classify. Finally, you look at the 3 fruits and check what class they belong to. If you find that 2 out of 3 of those fruits are apples, then you classify your unknown fruit as an apple. You use the majority rule to decide.

The KNN algorithm is based on the notion of analogy, or the idea that similar items are likely to belong to the same category.
The concept of using similarities for making judgments under uncertainty has been around for centuries. In particular, it was celebrated by the famous British philosopher John Stuart Mill, who coined the term ‘analogical induction’ to describe a method of making educated guesses about unknown things based on the number of similarities they share with known things. The method is so useful that it often serves as the backbone of the prediction algorithms many companies, such as Netflix, use to recommend new movies to watch.
Some contemporary thinkers, such as Douglas Hofstadter, go even further and claim that analogical thinking is the core process underlying all thought. The power of analogy comes from the importance of pattern recognition for human thinking: without it, we would not be able to know anything.
As much as it is powerful, the KNN method is not without some limitations. Some of the limitations come from the continuous nature of reality; it is very often hard to classify some instances as belonging to one class because they appear to be between classes.
For example, if you only had two options, would you classify this color as green or blue?

These are not trivial things, and people very often vehemently disagree about some classifications. Sometimes the disagreements are funny and entertaining, like when people all over the internet started debating the color of a dress. Other times they are very serious and involve classifying some actions as ethical and unethical.
The second challenge is deciding which features to take as relevant for classification. We can make anything a criterion for distinguishing between objects; but which criteria will give us relevant and useful classifications?
The answer to this question is not easy to find. More often than not, it will depend on what we wish the classification to do; in other words, what is the purpose of classifying?
Make your own classifier
As usual, now is the time to use Python to help you advance your understanding of classification. Today you will make your own classifier. You will learn some new and useful things.
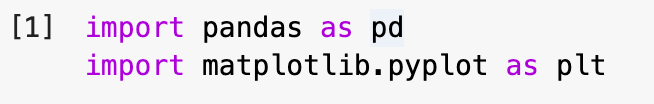
First, go ahead and open your Google Colab and navigate to a new notebook. In the notebook, start by importing the two libraries we will need, like this:
Python has a basic set of functionalities made when the language was invented in the early 1990s. Since then many people contributed to it by creating additional ‘libraries’ (collections of code) that help us do many things. That is the beauty of an open-source project: anybody can contribute to its growth and usage.
The two libraries we will use here are pandas and matplotlib (we import them using as pd and as plt so we don’t have to retype their entire names when we use their functions).
The first library, pandas, is great for managing a new data type we will use today: data frames. The second one, matplotlib.pyplot, is awesome for visualizing our data.
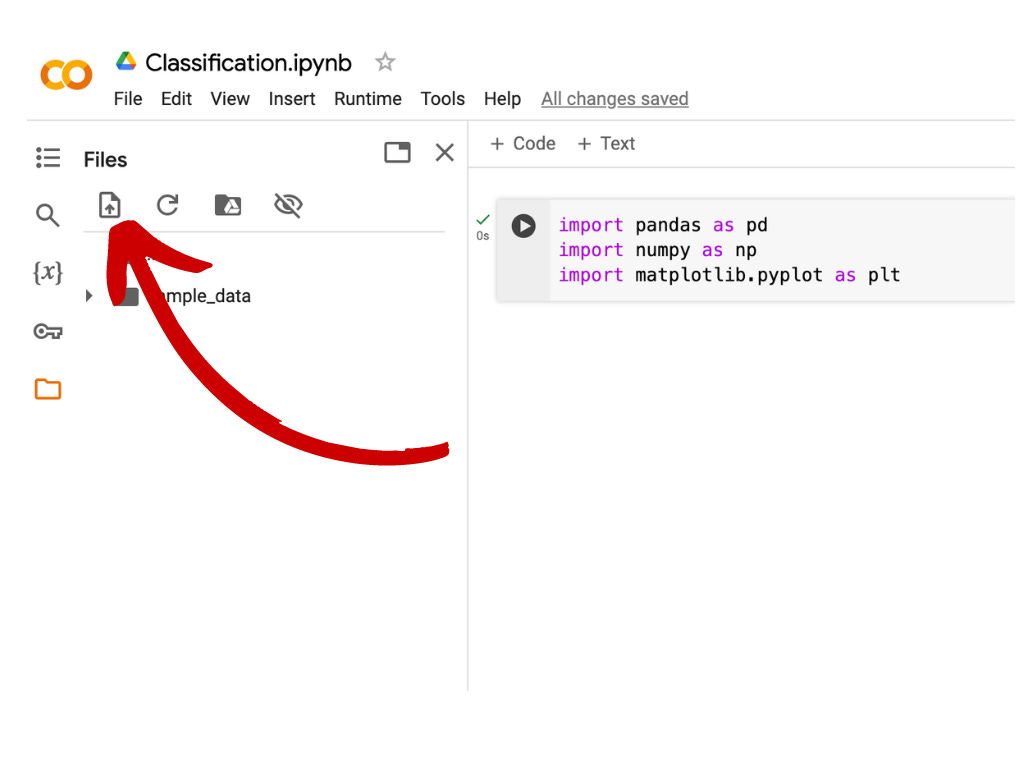
Once you do that, download this fictional dataset I made for you. Save it on your computer. Then, click on the folder icon on the left side of your notebook. See the picture below:
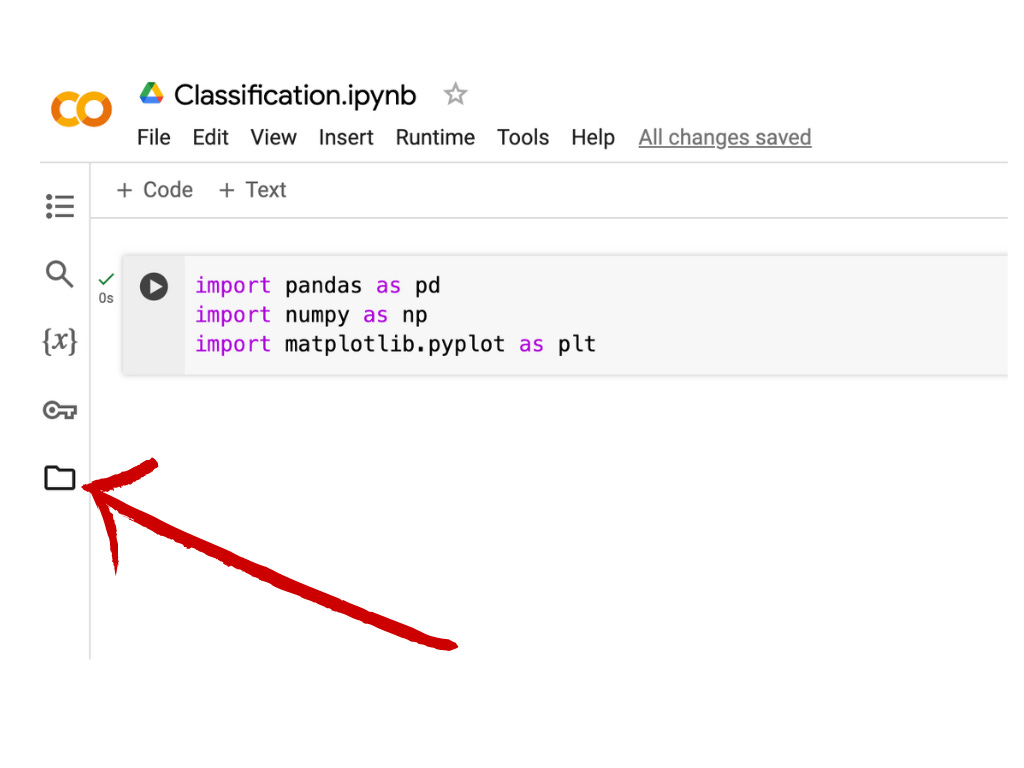
Go to the ‘upload to session storage’ icon, click on it, and navigate to the dataset you just downloaded to your computer. Upload it.
When you do, it should look like this:
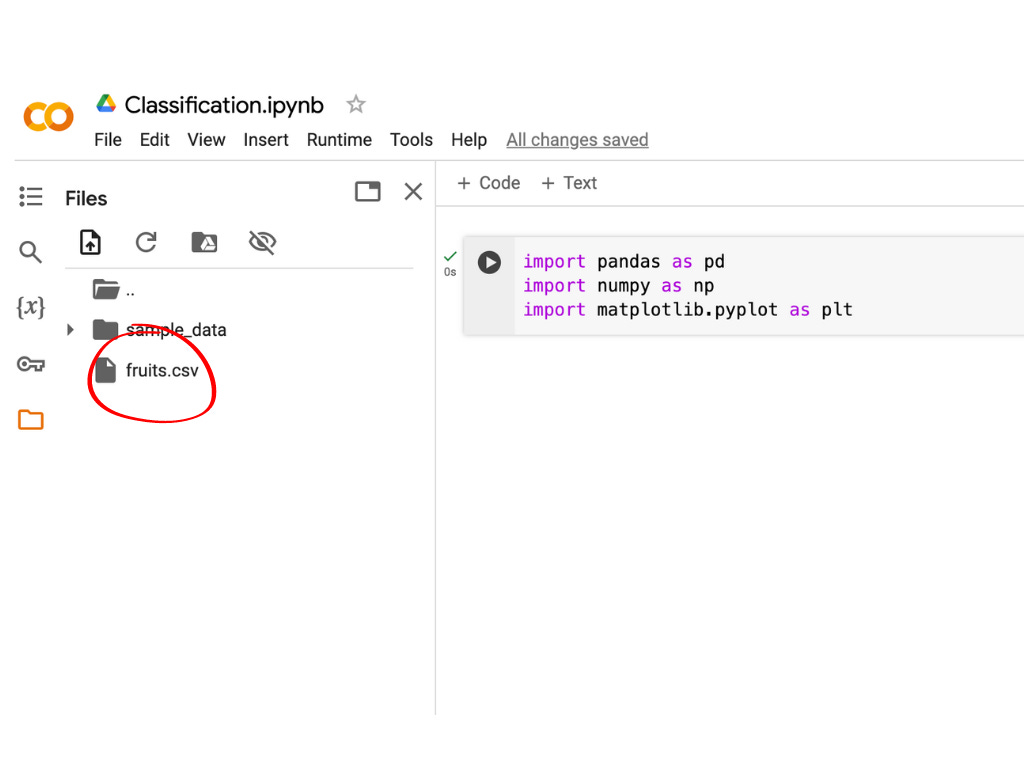
You may notice that I also uploaded another library, called numpy. It’s a shortcut for Numerical Python, and it is very useful when we work with numbers. Since our database contains some numbers, it might be useful to have it.
The dataset is a ‘.csv’ file. The domain stands for comma-separated values, and it is just a data storage format many other types of software use, like Excel.
Now, our dataset is imported into the notebook session, and we can start working with it. First, we need to read it into our notebook cell. To do that, we will use the pandas library, like this:
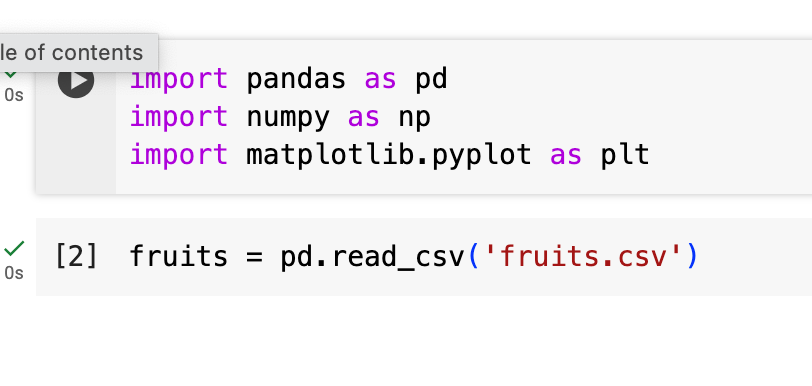
You can see that we’re using the function read_csv() from the pandas library because of the prefix pd (remember that we set this as our shortcut name for pandas). Inside the parenthesis, we type in the name of our dataset (which is imported) inside quotation marks.
We can display our dataset by simply typing its name and running the cell, like this:
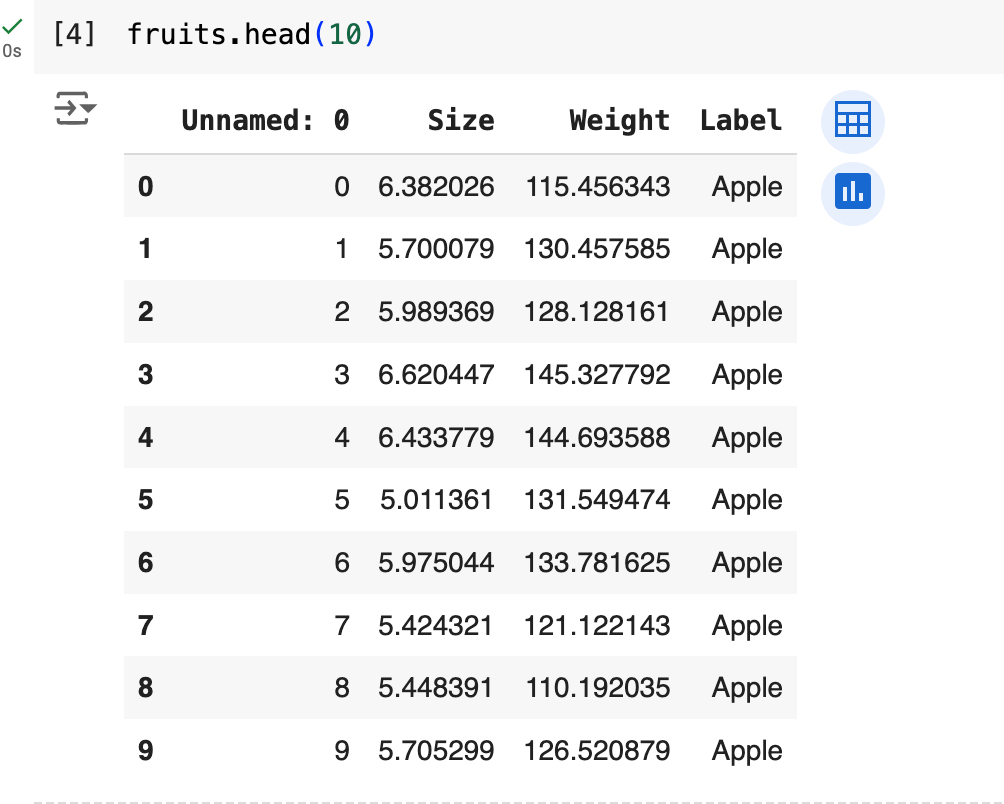
I appended .head(10) method to the name because I just wanted to see the first 10 rows. The entire dataset has 50 rows. If you want to see the last 10 rows, you can do this:
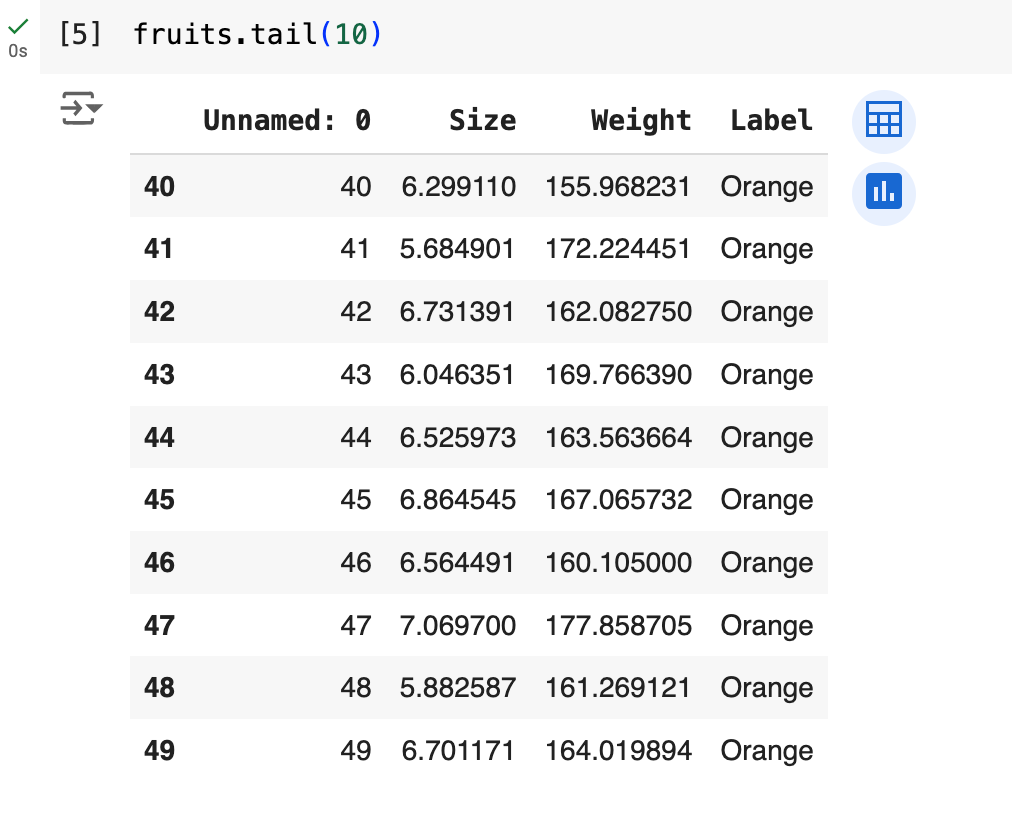
Data frames are great for organizing and displaying data. As one of the most useful and versatile data types, they pack a lot of information in a small space. They can have as many rows and columns as we need. The rows represent individual instances (objects) and the columns represent their features. Here, every row is a single piece of fruit, and every column describes some features of that piece of fruit: its size, weight, and label. Don’t worry about the units now (imagine size is the radius in centimeters, and weight is in grams).
However, data frames will not always be as neat as we want them to be, so we’ll have to do some cleaning. In the dataset you just downloaded, we can see that there is a column labeled as ‘Unnamed: 0’ which we don’t need (it just repeats the order number of each row), so we can remove it like this:
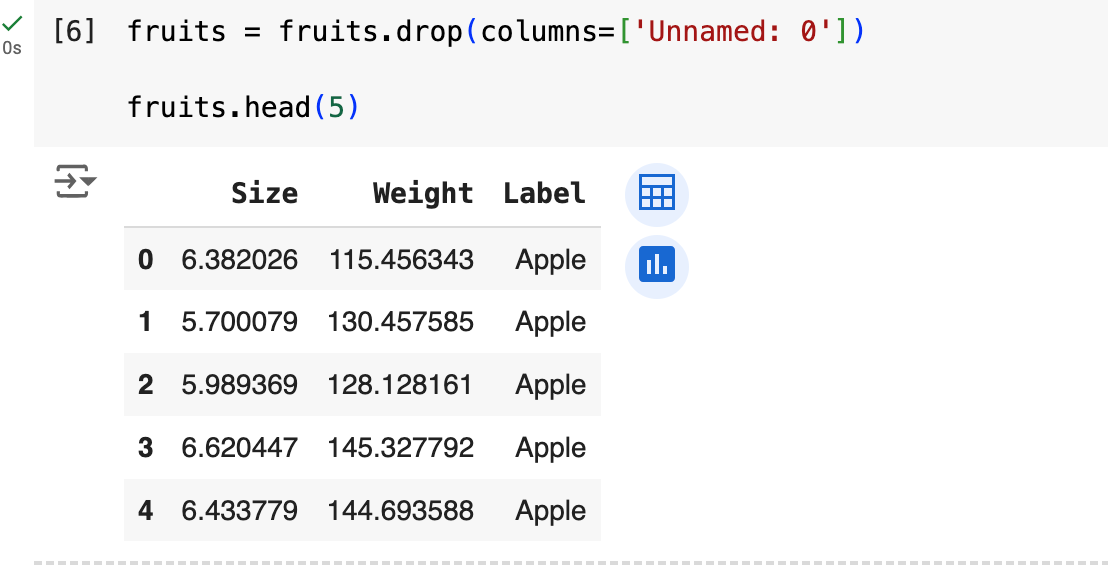
As you can see, I not only removed this column but I also displayed the dataframe again (this time just the first five rows) to verify it is removed. It is no longer there. Nice.
Manipulating data frames with Python’s pandas library can be sometimes challenging, but also fun because it allows us to do a lot of things. For example, we can easily access each column separately and list its contents.
Like this:
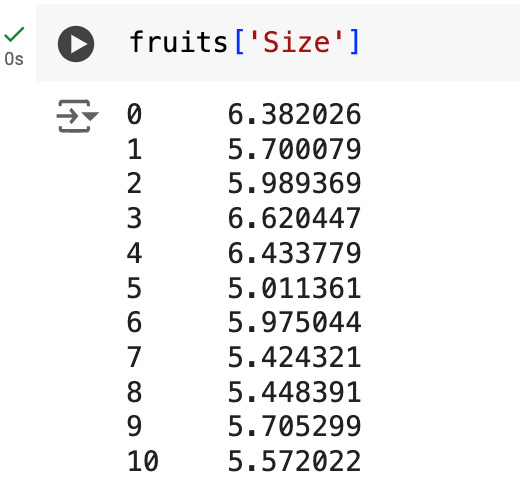
Here I wanted to see all the size values in this column. I used the square brackets after the name of the data frame and typed in the name of the column (since the names are strings, I had to use quotation marks). We can do that with any other column.
Exercise 4: Use the same method to check the values of the 'Weight' column.We can now use these different columns of the dataset (Size and Weight) to make a two-dimensional plot and try to get more insight into our data.
Here’s how to do that (I’ll explain the code below):
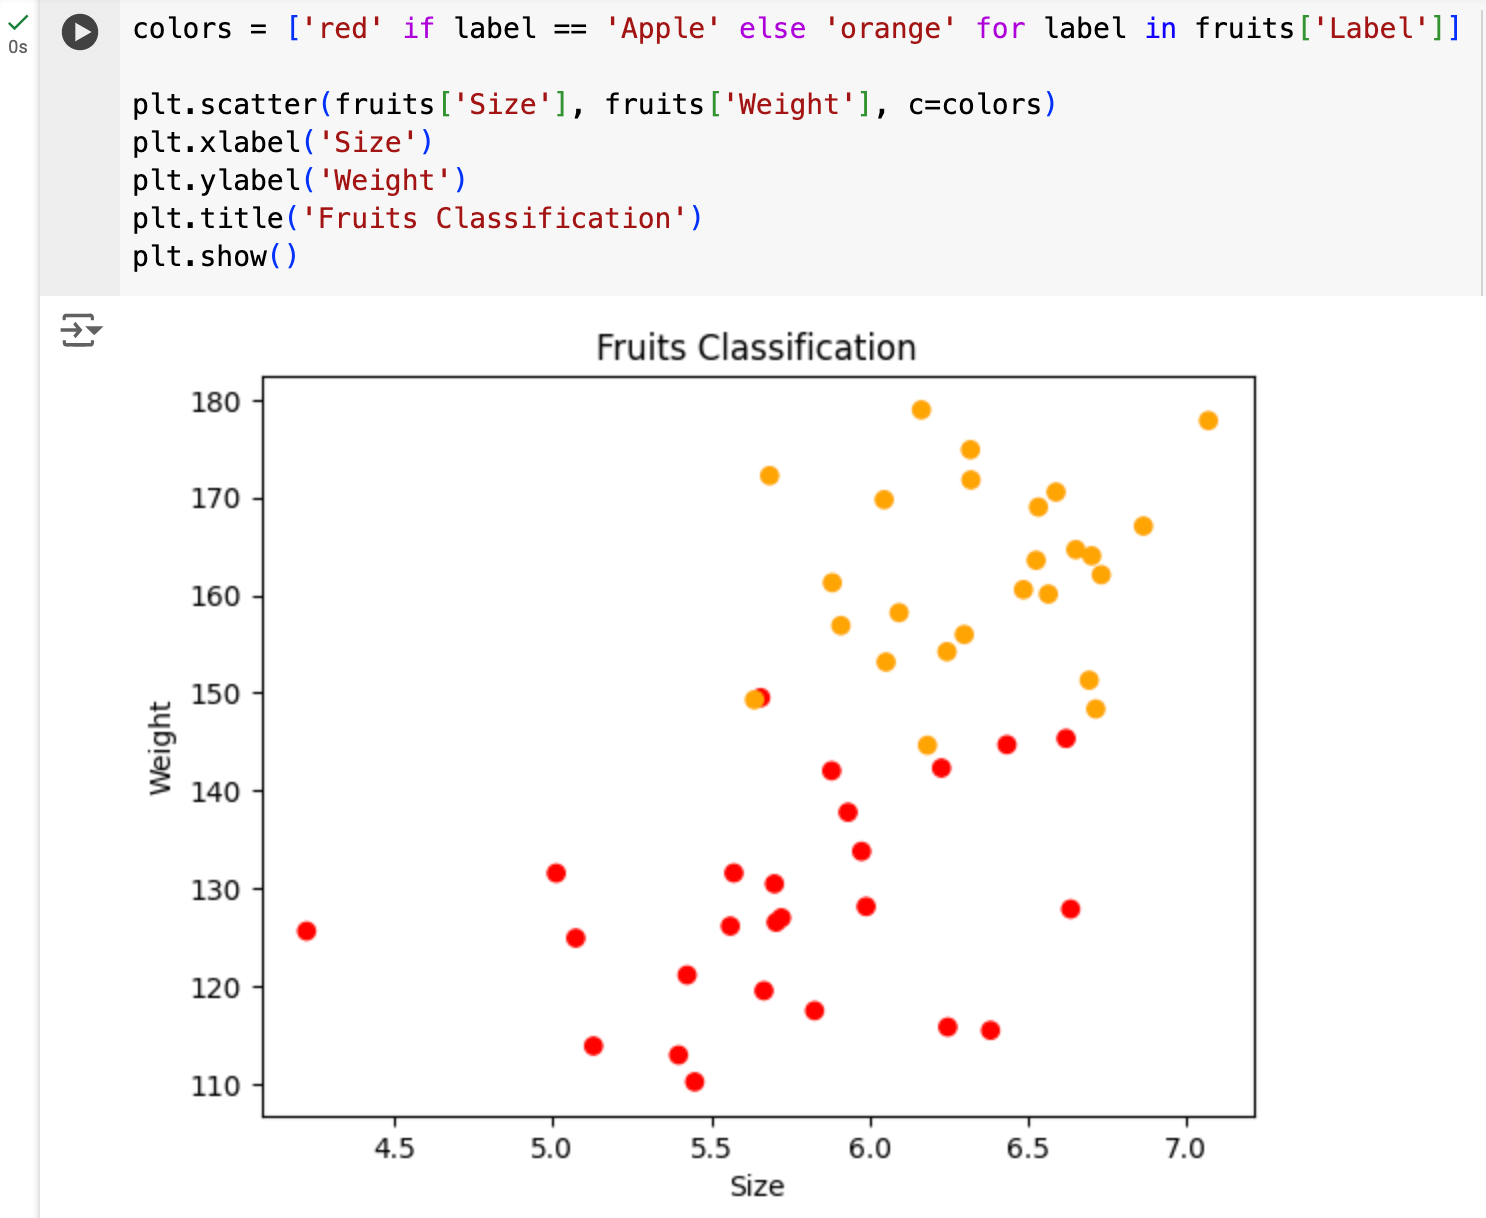
First, I wanted to use two different colors to distinguish the instances (rows) depending on whether their label is ‘Apple’ or ‘Orange.’ In Python we can set basic colors by just using their name in quotation marks.
In the first line, you see the Boolean logic we talked about in some of the previous lessons. If the label is ‘Apple’ then color is set to ‘red’, and if it is not (hence else) then the color is set to ‘orange.’ This piece of code creates a simple list of ‘red’ and ‘orange’ colors based on the label of each row. I name this list simply: colors.
Then, I use the matplotlib library to make a special kind of plot that is called a ‘scatterplot.’ The plot uses two subsets of data we provide it and projects them on x- and y-axis. You can notice that within the parenthesis of the plt.scatterplot() function the first input is the fruits[‘Size’] which gets projected on the x-axis, and the second one is fruits[‘Weight’] which goes on the y-axis. The scatterplot makes a point for each x and y pair and displays them on the chart. Besides the data, the plt.scatterplot() function also allows us to specify color with the c=colors input. Because we made a list of colors that is synchronized with the label of each instance, the color of each point of the chart will be set accordingly.
What we did here is called ‘data visualization,’ and it is a super useful method to get insight into some things that might be harder to see from the data frame itself. Although there is some overlap in the two classes of fruit here, you can immediately recognize that there is a lot of difference two. It looks like the centers of gravity for each type of fruit are different: oranges are both larger and heavier than apples.
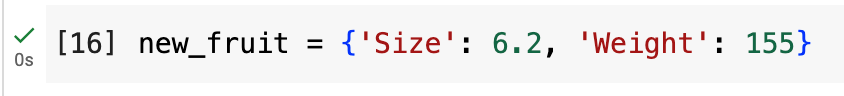
Now, the real power of the KNN method is in helping us assign class membership to some new instance we see. Imagine we get a new fruit and we don’t know if it is an apple or an orange, but we do know its size and weight.
Let’s use a dictionary to specify this new fruit, like this:
Then, we can include this in the plot to see which group this fruit is closest to. We can simply add another scatterplot as a layer to the existing one, like this:
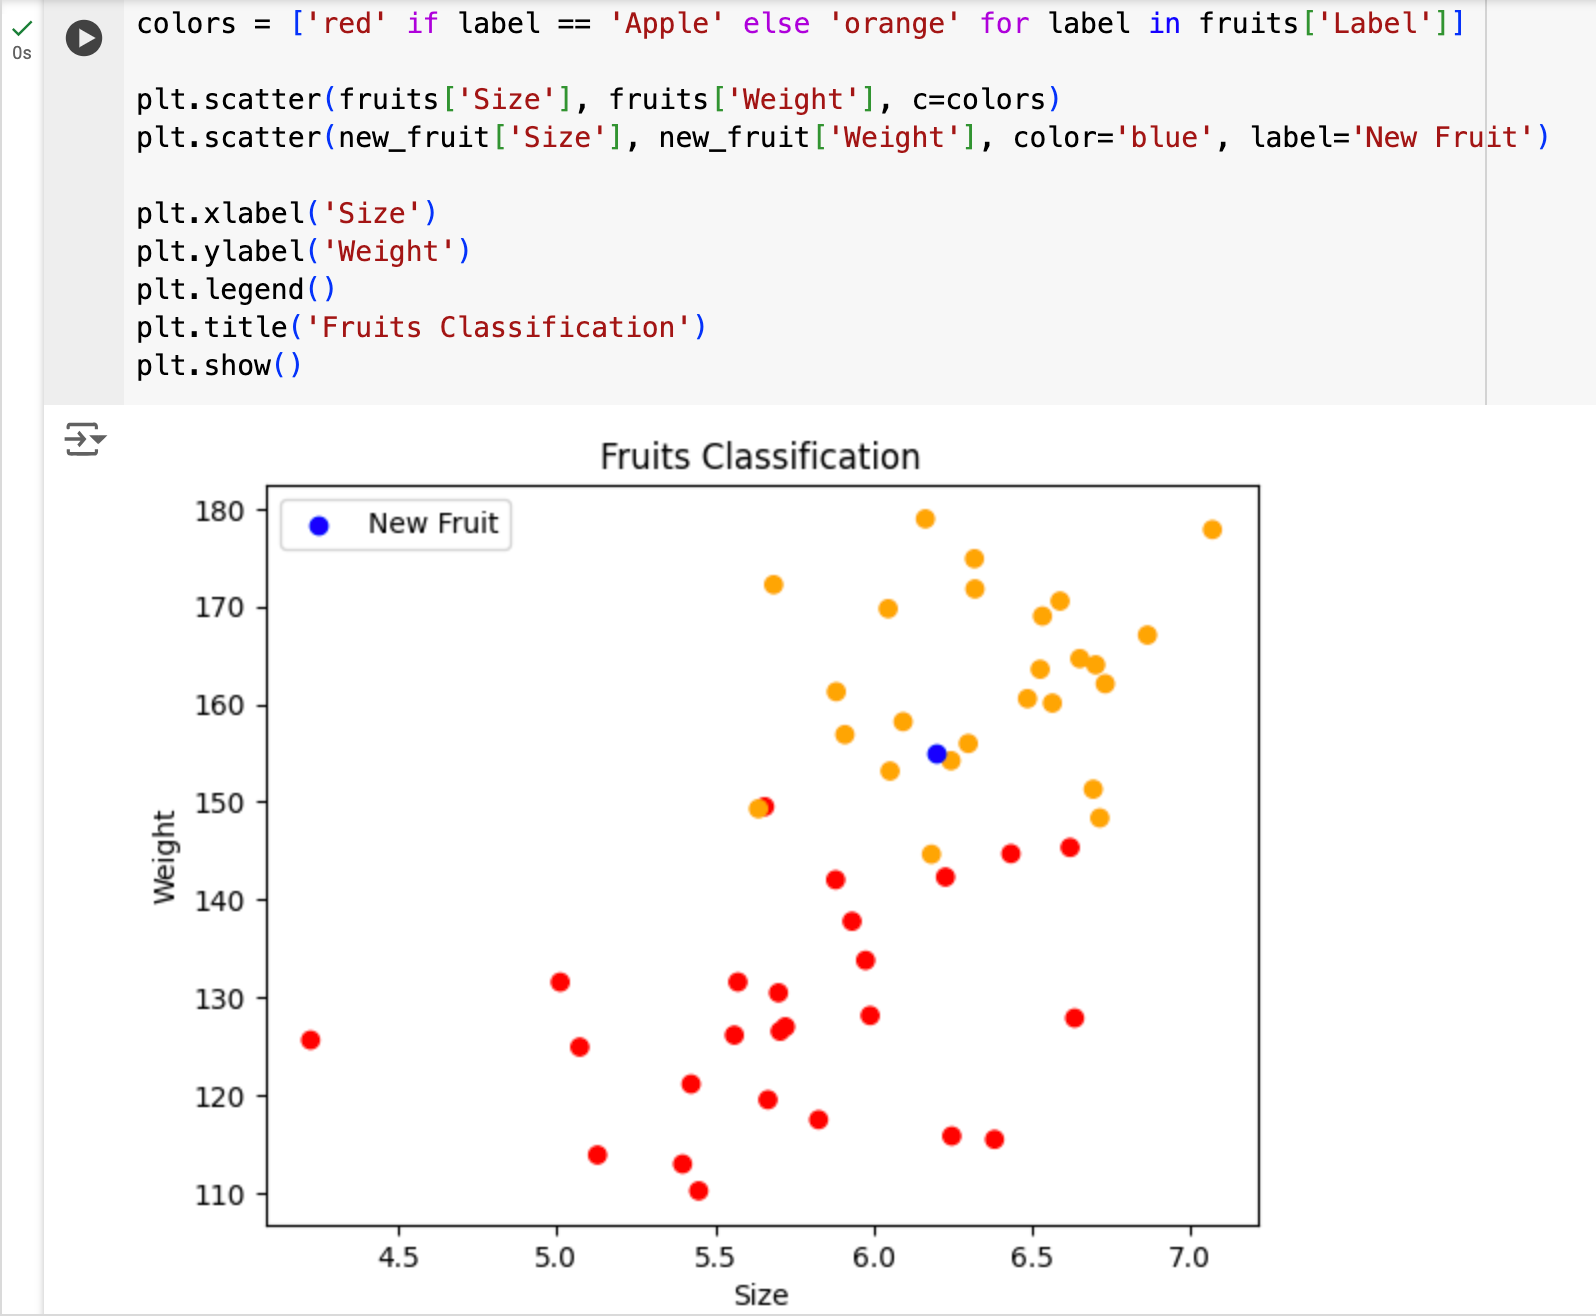
To make the new fruit more visible, I set its color to blue and added a legend using plt.legend() to display it within the plot.
You can easily eyeball it and conclude that this new type of fruit is more likely to be an orange rather than an apple.
Of course, there are more precise computational methods to establish that, but for now, your eyesight is enough to determine that for any value k from 1 to perhaps 10 or so, the k nearest neighbors of the new fruit are oranges.
Exercise 5: Set another piece of fruit and determine it's size and weight (use any values you wish). Plot it on the chart in the same way and determine whether it is more likely to be an apple or an orange.Conclusion
What we briefly touched on in this lesson is not only an exciting topic in critical thinking, but also one of the key concepts in the fields of machine learning and artificial intelligence.
While these are complex fields with great traditions of thought lasting for decades, they all rest on concepts that we use every day. One such concept is the idea of analogy: the principle that looks at the similarity of different objects in some relevant aspects and uses that similarity to reach conclusions when we’re uncertain about what is the truth.
I’ll see you in the next lesson!
Proper set theory notation would be a bit different, but that does not matter now, as long as you understand the concept.
Two sets can be identical, for example, A = B. In this case, A is a subset of B, and B is a subset of A. When that happens, then the subset relation is improper. A proper subset is one that is not equal to the superset, it has to be smaller.