


Being Philosophical About Data
Thinking Critically in the Age of Algorithm

Caveman to Coder
If you’re reading this, chances are you are already aware of the importance of understanding and manipulating data. Now more than ever, we live in the age of data, a time in which every aspect of our existence has been recorded or measured in some way.
I’d like to invite you to think about yourself a little bit, and your position in the timeline of human existence.
Think about your ancestors first. To be considered ‘educated’, your parents needed to have at least a college degree, your grandparents a high-school degree, and your grand-grandparents were considered educated if they were at least capable of reading and writing.
These were not arbitrary requirements. They reflected the exigencies of the time and place in which your ancestors existed. While it may seem funny to compare yourself, a creature of tweets, posts, podcasts, reels, likes, and follows, to your grand-grandparents who may or may not have ever seen a TV set, this comparison is important because it reveals something fundamental: the nature of what counts as knowledge is changing. With it comes the change of what it means to be ‘knowledgeable’.

One important difference between modern and pre-modern humans is, of course, the amount of knowledge we possess. To describe this, let’s imagine that we could quantify all the knowledge we have by counting all the true sentences we have at our disposal. If we did that, we could make a list of all of these true sentences and put them in a table, like this:
Water boils at 100 degrees Celsius at sea level.
The Earth orbits around the Sun.
Oxygen is essential for human respiration.
…
…
If we compared our list with the list available to our pre-modern ancestors, our list would be much longer than theirs. Measured in purely quantitative terms, we know more.
But, why? Why do we know more?
One obvious reason is that knowledge is cumulative. Every generation learns something and transfers it to the next generation, which learns more and then transfers both the received and acquired knowledge to the next generation and so on.
But, another more important reason is that modern humans have invented a way to systematically acquire, evaluate, and communicate knowledge. We call it science.
Science is one of the most amazing achievements of humanity if not the greatest of them all (yes, even more amazing than TikTok). It enables us to understand and harness the forces of nature more than any other generation in human history.
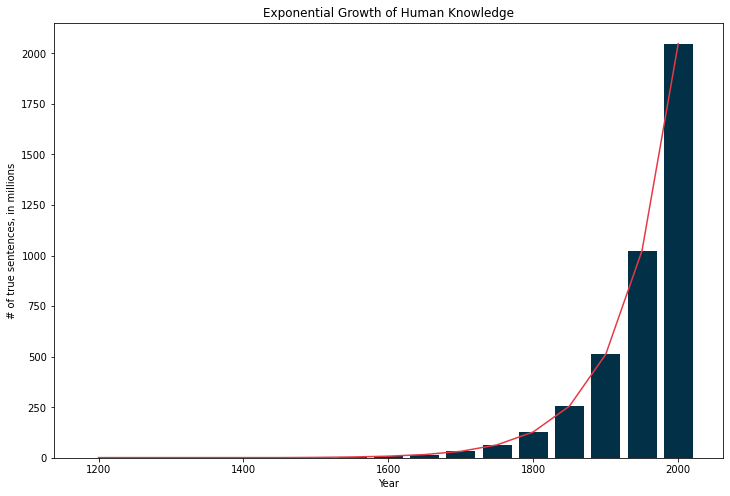
Think about this: according to some estimates, our species, Homo Sapiens, is around 300,000 years old. We will probably not exaggerate much if we say that there has been more knowledge produced (more true sentences added to our collection) in the last 10 years than in the entire period between the dawn of Homo Sapiens (that is, 300,000 years ago) and the birth of modern science, in the 16th Century.
If we could represent this growth with a chart (mind you, this is just hypothetical, ain’t nobody got time to count all them true sentences), it would probably look something like this:
I really do hope you can pause for a few minutes and reflect on this. Look around you. You live in a house or an apartment that has electricity, running water, internet, cooking gas, washer, hairdryers, smartphones, computers, and a bunch of other devices. Maybe you have a car, maybe you travel by subway, or airplane, have cousins across the globe you talk to over the phone.
Now, I want you to realize this: none of that is given by nature. All of it is in your life thanks to science.
Without science, we’d still be living in mud huts.
An obvious question to ask is: why is science so effective? How is it possible that humanity has been able to achieve so much by simply (or, ‘simply’) using science?
This is a complex question, and I will not dwell much on its complexity, but I do want to point out one crucial reason:
Science enabled humans to embrace uncertainty, instead of running away from it.
Since the dawn of Homo Sapiens, uncertainty has been a constant companion of humans. People have always been aware of the radical unpredictability in life.
Is it going to rain tomorrow?
Will there be enough food for us next month?
If I step on this tree branch, will it break?
Will I live to see my grandchildren?
If I eat this berry, will it poison me?
Definite answers to any of these questions don’t exist, and this has caused a lot of fear and anxiety in pre-modern humans.
Faced with the radical unknowability of most things that affected their existence, early humans resorted to myth and religion.
‘It rains because Gods are angry.’
‘If we pray and give sacrifice, the Gods will give us food.’
Faced with uncertainty, they retreated from it and sought refuge in concepts and ideas that gave them assurance that there are larger forces pulling the strings, to whom nothing is uncertain. Even today, conceptions of God in every religion presuppose that ‘God knows everything,’ and uncertainty is not a problem that he (it’s always a ‘he’) faces.
Believing in an almighty force freed from the pressure of uncertainty has always been a coping mechanism for people afraid of not knowing what happens next.

But, even among pre-modern humans, there were some who tried to face uncertainty by observing the world more carefully and thoughtfully and thinking hard about those observations.
Rain happens every time certain types of clouds gather in the sky.
Food is abundant when there’s a lot of (but not too much) rain.
Whenever a grown man steps on the branch thinner than his forearm on this type of tree, the branch breaks.
Individuals who spend more time hunting than gathering tend to live longer.
Berries of this color kill those who eat them.
Our ancestors who observed the world and tried to understand its inherent uncertainty instead of running away from it, noticed that our world is permeated by certain patterns that occur everywhere. The world may look chaotic and unpredictable, but there are some connections between different phenomena that follow a fairly predictable pattern. These guys (and gals) were our proto-scientists, intellectual grandaddies of people like Albert Einstein, Marie Curie, Stephen Hawking, and, of course, Art Vandelay.

If I could describe a skill that enables humans to recognize these patterns and dig out the truth amid radical uncertainty, I’d use this term: Critical Data Literacy.
Though not synonymous with the concept of scientific methodology, Critical Data Literacy inherits a lot from it but emphasizes one very specific aspect: the attitude one has toward the information coming from the world.
In a nutshell, it is based on a serious and systematic collection of facts about the world (also called ‘data’) and their careful analysis. Science discovers truths about the world and then uses those truths in a clever way to make smart guesses about things we don’t yet know. It faces uncertainty head-on and tries to find a way around it.
But there’s more to it.
What is Critical Data Literacy?
I recently gave a talk at the 2025 Open Data Week in New York City, one of the largest gatherings of data nerds in the world, about the concept of Critical Data Literacy, and this article draws from that talk.
My main point was that having insane amounts of data and fancy algorithms backed up with an equally insane amount of computing power will not necessarily make us good thinkers. It will not guide us to the truth by itself. Instead, we need to adopt a certain philosophical attitude towards the data.
But, what is a philosophical attitude towards data?
One of the most important aspects of data literacy is cultivating a healthy skepticism. As we become more adept at working with data, it’s crucial to maintain a critical perspective and not take everything at face value.
The ‘critical’ in Critical Data Literacy refers to two things. First, to data themselves. A critical perspective on data helps us use data to understand what is true and what is not. It will help us avoid mistakes and manipulations that often follow data. Famous American writer, Mark Twain once said that there are three kinds of lies in the world: ‘lies, damned lies, and statistics.’
While this may have been a joke by a well-known jokester, it tells us a lot about this: there are some people who skilfully use data and statistics to promote views that are not true; basically, people do use statistics to lie, and they do that very often, and very skillfully.
Caution against the misleading use of data is not of a recent date. For example, a book published in 1954 by a journalist Darrel Huff, called ‘How to Lie With Statistics’ showcased some of the most favored statistical sleighs-of-hand used to trick people.
The book did not advocate lying with statistics; rather, it aimed to warn readers about how statistics can be manipulated to deceive or mislead (despite making mistakes as well and having a somewhat deleterious impact on the status of statistics in public).

So, one of the most important tasks in developing a scientific attitude is learning to understand the practice of data analysis so you can recognize when these tricks are used. You must learn about various concepts (starting from simple ones such as mean, median, and mode, to more complex ones like linear regression and decision trees) and their proper and improper uses; you must understand how to read, interpret, and even make charts using different kinds of data; and, you must learn about most common traps even the best data scientists fall into when working with data.
In all fairness, some of the mistakes in data analysis happen inadvertently, not because the analysts are manipulative, but because working with data is often very hard.
You will have to learn some hard things.
Secondly, critical in Critical Data Literacy also refers to your attitude and disposition towards your own culture People very often make strong claims about something without providing any data that could back up those claims as evidence.
Here are some examples:
Health and Medicine: Claims about the efficacy of diets, exercise regimens, and alternative medicines are often made without rigorous scientific evidence. For example, some might claim that a particular herbal remedy can cure a specific ailment without any data to support such a statement.
Politics: Politicians frequently make claims about the effects of policies, such as crime rates or economic indicators, based on selective or misleading data. Statements like ‘Crime rates have gone down due to my policies’ often lack contextual data or may intentionally ignore other contributing factors.
Economics: Assertions about economic conditions (‘The economy is doing great!’) often rely on a selective use of indicators, like stock market performance, that do not represent the economic situation in general.
Religion: Claims about the efficacy of prayer in healing physical ailments are often made without scientific study. Or, more broadly, assertions that adherents of a particular faith are more ethical or happier than those of other faiths often lack statistical backing.
Environment: Statements like ‘Climate change isn’t real’ or ‘This policy will save endangered species’ often lack comprehensive data and can be based on biased or incomplete information.
Consumer Products: Marketing often makes exaggerated claims about product effectiveness that are not substantiated with rigorous testing (‘Removes 99% of stains’).
Criminal Justice: Statements about the efficacy of punitive measures like the death penalty, or drug legalization in deterring crime often lack empirical support.
Thus, it is crucial to be critical of our own culture. In everyday reasoning, data plays a crucial role as possible evidence that has the power to either back up or challenge claims made about anything. Being data literate will help you understand when (and what kind of) evidence is required for different kinds of claims.
This is why a philosophical perspective on data is crucially important. It is, in the end, one of the main reasons why I, a philosopher, am writing about data. As we march boldly into the world of highly efficient and intelligent technology, relying on an intellectual discipline that is more than 2,500 years old, is more important than ever.
But, what does that mean in practice?
Data and Existence
It means thinking about data in a ‘deep’ sense, inquiring not only into procedural or technical aspects but also asking questions about meaning, purpose, as well as assumptions that underlie any data analysis.
Why?
Because thinking about data is an integral part of thinking about some of the most vexing (and most basic) philosophical questions, like the nature of existence.
Many philosophers have asked themselves (and others) about the existence and non-existence of things (some were even doubtful of their own existence). There is a whole subdiscipline in philosophy, called metaphysics that studies these questions. The term is a construct of two Greek words, ‘meta’, which means ‘beyond’, and ‘physika’, meaning ‘nature’, or ‘physical reality’. Metaphysics concerns itself with what is beyond nature, or beyond physical, measurable things.
We don’t have to join this particular party, but we do have to at least assume that some things exist before we continue. Not only that, we need to describe and clarify the features of those things that we assume to exist. In other words, we have to make some metaphysical presumptions.
Plain Facts: Level One
Let’s organize our universe of existence into three layers. In the first layer, let’s place data and assume that the data exist. That is, let’s accept that whatever can be expressed as data is real and that we can access it through our senses. For example, all humans have a certain weight. This weight is expressed as numerical data (say, I weigh 191 lbs) and can be perceived through senses, either directly (by lifting a person and assigning a number to how heavy they appear to be) or indirectly through a weighing device that does this job for us.
Second, we need to assume that something ‘generates’ the data, in the sense that something determines ‘the shape’ of these data. In other words, there is some kind of a natural force or a law that determines how these particular data look like. For example, no living human weighs 1,000 lbs, nor 0.000001 lbs. Something about the structure of the world we live in determines that the average human weight for a US male is around 190 lbs.
So, if we plot the weights of 52 men randomly chosen from the United States and plot their weight on a chart, it would look like the one in the chart below (note that this is not real data, but an example. See real data here). On the x-axis are the weights from 100 to 260 lbs grouped in blue bars, and on the y-axis are the numbers of men whose weight corresponds to each bar. On this chart, you can see that out of 52 randomly selected men, 11 weigh around 180 lbs.
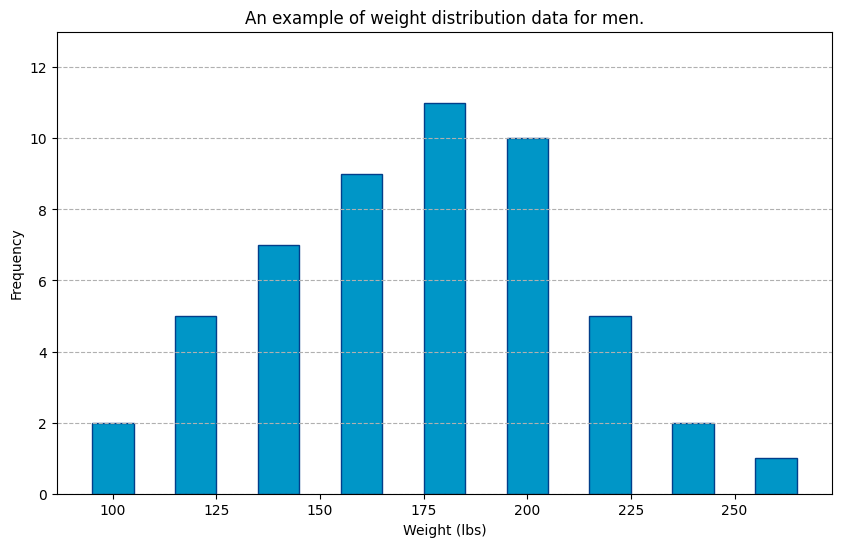
What is interesting about this is the particular shape of the distribution of these bars. They seem low on both ends and high in the middle. If you do your research and try to find the weight distribution of any group of people in any country in the world, chances are that the shape of that data distribution will look similar to this.
But, why is that?
The Source: Level Two
The answer to this question indicates the second layer of existence that we shall accept.
Namely, we will assume that behind any data there exists some ‘force’ that affects how data are distributed. For example, maybe there is some kind of ‘physical necessity’ that determines why the human weight comes in a specified range. Whatever it is, it means that there is some truth out there and the data is an imperfect reflection of that truth.
Why do I say ‘imperfect reflection’? Well, because, the truth about human weight encompasses all humans, not just the ones we have data about. Whenever we acquire any data, we only get a tiny portion of that truth. This tiny portion is called a sample. It’s a sexy name that only hard-core thinkers use.
Any successful data analysis rests on understanding and being constantly aware of the distinction between what we know and what is true. This may be a shock to you, but even when scientists know certain things, they are fully aware that their knowledge of those things doesn’t cover the entire range of truth about it.
What we know may, or may not, overlap with the underlying truth.
The reason this is so has to do with our main antihero: uncertainty. It is like an opaque layer between our minds and reality. Even when the layer is super thin and we can see a lot through it, there are parts of it that obscure what’s underneath. Uncertainty is always there, our existential companion.
But, since our job is to understand reality, we have to keep making educated guesses about it. When we use data to do so, we are estimating the reality. For example, if we say that the mean weight of US men is 175 lbs, and we refer to the data we collected, then the statement about the average weight of men in the US is an estimate of the true weight. Our estimate may be precise, or may not. That will depend on many things, and the purpose of Critical Data Literacy is to be informed about them.
Multiverse: Level Three
Data is our first, and truth is our second layer of assumed existence. I hope it is clear how these two layers relate to one another.
We are not finished, though, because we have another, final, third layer. In this layer, we will place an assumption that when it comes to anything expressible with data, there are many possible truths. And these possible truths, which we will call ‘possible worlds’, also exist.
If you think that assuming the existence of possible worlds is a matter of science fiction, let me reassure you that it is not (at least not completely).

I’ll try to persuade you by example.
Right now, you are reading this article. At any moment in time, while you’re reading it, you have the option to stop reading it and do something else (like get up, go to the fridge, and get a snack). The fact that you have the option and freedom to do so, is an existential truth about the world we live in. Most of the time, we have options to change the trajectory of our actions (whether we do that or not is a different question).
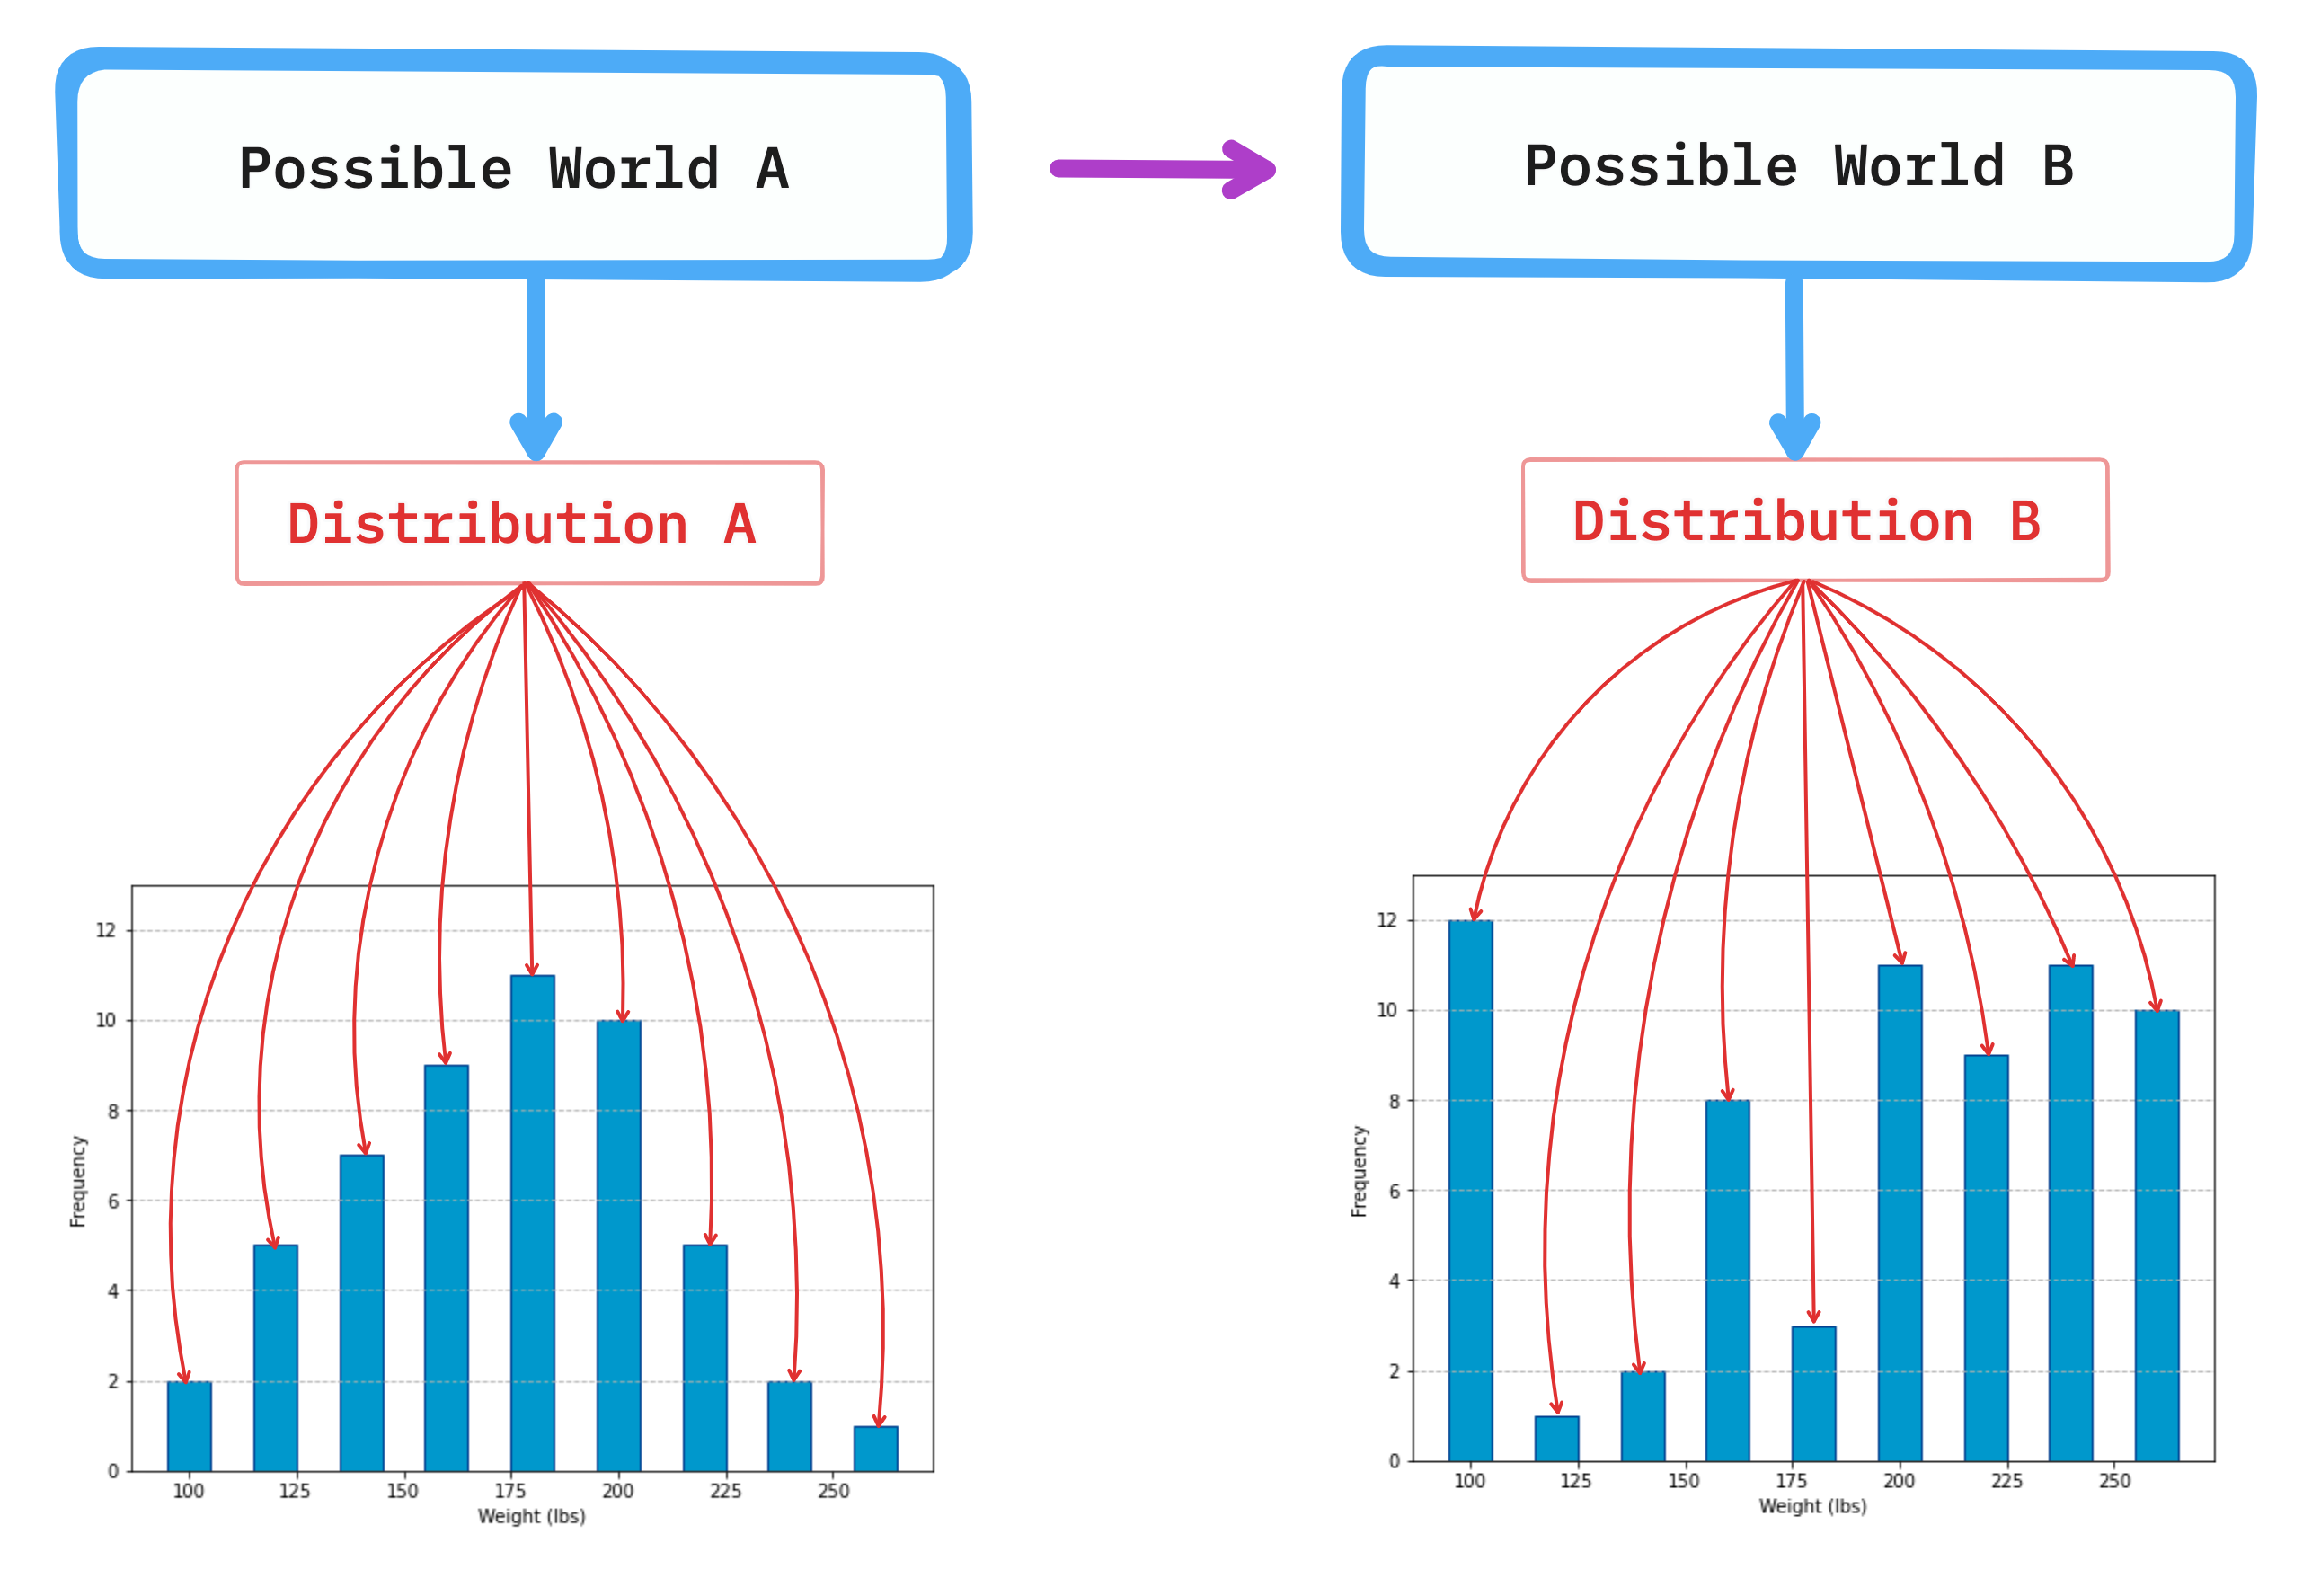
The actions we choose to do affect the reality, which in turn affects the data. Your choice between the world in which you continue reading this article and a world in which you stop to get a snack will affect the distribution of weight.
Again, let’s look at a graph to help us understand this.
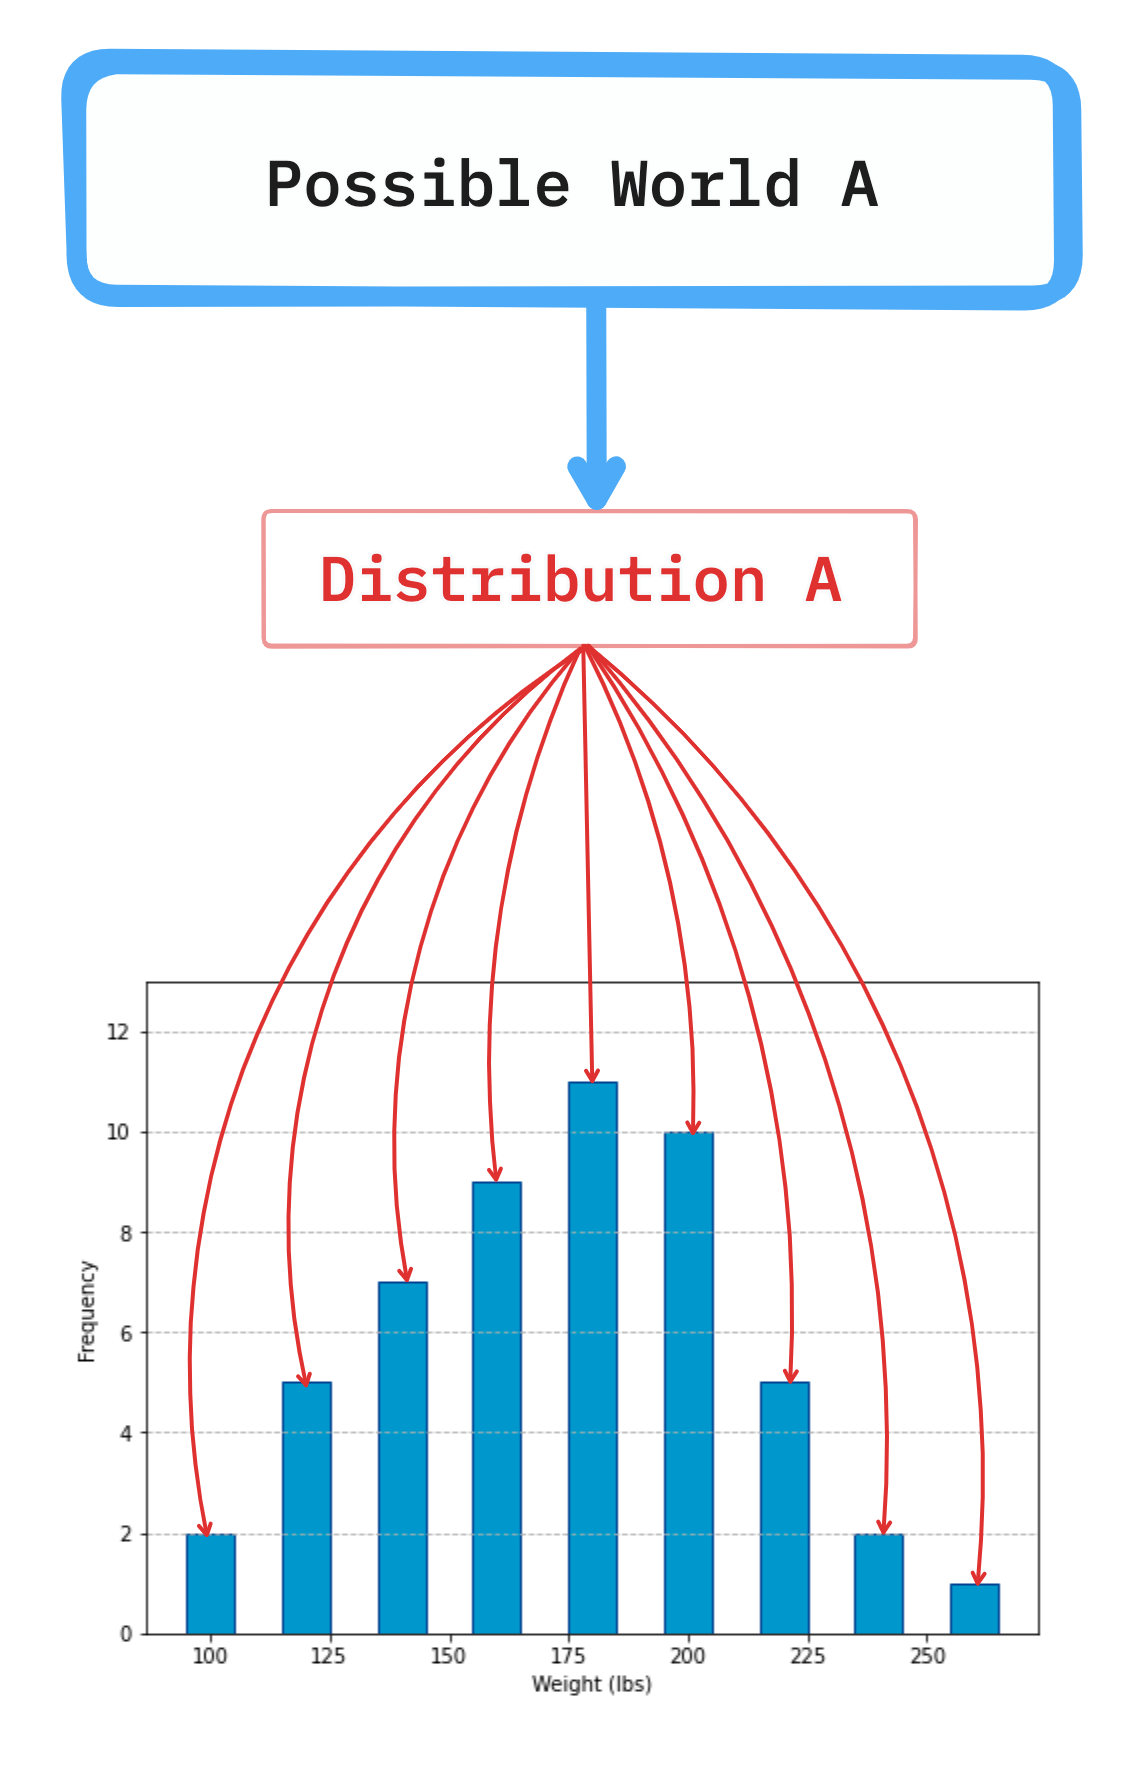
Possible worlds are situations that depend on our actions. If we make changes in the ways we act, we change the character of the world we live in and by doing so affect other things. Scientists use this concept all the time (without resorting to the sci-fi flavor of the term ‘possible worlds’) when they conduct experiments. Whenever they administer some kind of treatment to the subjects in the experiments (be it mice or human volunteers), they change world A into world B and record new data distributions that appear.
For example, in world A all the mice in the lab have the same weight. Scientists then give them some weight-loss medicine (thus changing the world to B) and observe the new weight distribution in this world.
You can see it graphically in the figure below. Whenever we act to change something in the world, the data distributions change.
Think about government policies, for example. If the government made a law to limit the consumption of some weight-gaining substance (like sugar, for instance) that would usher us into a different world and the distribution of weight among people would change.
This is perhaps just a fancy way of saying that data are very sensitive to our actions and behaviors. Whatever we do leaves a trace in some kind of measurable data. That is why it is important to be aware of the existence of possible worlds when thinking about data.
Uncertainty, My Old Friend
You might have guessed by now that the main motivation behind the necessity to become data literate is the realization that life is uncertain.
In most aspects of our lives, we can’t really be sure what is true and what is not, or what will happen in the future. Here’s a banal example: whenever you leave your house to go to school or work you try to make the best predictions possible about the weather. This is important for you because what kind of weather will occur on any day influences your choices about what you are going to wear, or whether you will bring an umbrella or not.
You can’t, in principle, know with certainty what’s the weather going to be like. You can make an educated guess by looking at the sky or checking the weather app on your phone. But, none of these observations will give you a sure answer. Even the weather apps, which are quite sophisticated and precise these days, will express their predictions in uncertain terms (‘15% chance of rain’ or ‘90% chance of rain’).
As I said, this is quite a banal example. There are plenty more very important aspects of our lives in which we lack any kind of certainty about the outcomes.
Will you get a job after you graduate?
Will your marriage last?
Will you live to see your grandchildren?
Sources of Uncertainty
There are two main sources of this uncertainty. One is the uncertainty associated with measurement. Basically, whenever we measure anything, we do it using certain tools, and these tools are not themselves perfect. For example, we measure weight using a digital scale. We stand on it, and it reads us our weight, expressed as a number on a certain numerical interval, pounds or kilograms. But, the scale is not perfect: due to possible production error, or its age, or the ground it stands on, it can never measure our weight absolutely correctly. It will always include some error, even if the error is tiny and unnoticeable (most scales measure up to one or two decimal places anyway, so you can never know if your weight is exactly 191.5587 or 191.5511 lbs).
This is the case with any measurement, and error even increases as we aggregate across different individual measurement results. When we collect data from hundreds or thousands of individuals about their weight, each of those individual measurement errors (no matter how small) gets added to the pile of total measurement error.
Second, there is uncertainty associated with natural variability. Whatever we choose to measure, there will always be variation in our measurement. If you weigh yourself in the morning and in the evening, you might notice a slight change in your weight (if your scale is able to express weight in more than one decimal place). You don’t weigh the same each day. This is even more pronounced when we compare different individuals. Regardless of the fact that human weight tends to some average, no two persons weigh exactly the same (if measured precisely enough, that is).
Data literacy implies being aware of these two different sources of uncertainty. While uncertainty caused by measurement error can be avoided, the one caused by natural variability cannot. The only thing we can do about natural variability is understand it: learn where it comes from, how it manifests itself, and how it limits our pursuit of truth.
Understanding this variability is a big part of what lies ahead; you will learn much more about it.
Problem of Induction
To understand this pervasiveness of uncertainty, we can delve into a broader philosophical concept known as the ‘problem of induction’, a conundrum proposed by the famous Scottish philosopher David Hume. Induction, as Hume understood it, is our practice of drawing general conclusions from specific experiences or observations. An example of this is predicting rainfall when observing dark clouds, an induction based on countless previous experiences of similar situations.
However, Hume postulated that such reliance on past experiences for predicting future outcomes, while practical and useful, does not guarantee certainty. He argued that no matter how many times a specific event has occurred in the past, this does not make its occurrence in the future certain.
This problem of induction, reverberating through the disciplines of philosophy and science, echoes our experience of life. As in the metaphor of walking toward the future backward, our past experiences inform our understanding, yet the future remains a step out of sight.

This philosophical understanding underscores our discussions about weather prediction, career prospects, marital longevity, or life expectancy. It is a reminder that we make our decisions based on the patterns we have learned from past data, which can help us make educated guesses but cannot eliminate the fundamental uncertainty of the future.
Nonetheless, this is not a reason to despair. Even though we can’t get around uncertainty, we can manage it through the skillful use of data. Data are our eyes that help us ‘see’ things in the dark. I put the words ‘see’ in quotation marks because we never get to see things beyond the veil of uncertainty, we only get to guess what they are. But, if we understand and use data skillfully, our guesses can be pretty good. We can be quite successful in knowing things that are not directly visible to us, and sometimes even predicting the future with high levels of confidence.
All of this is possible through Critical Data Literacy.
This article is merely a step on the road to reducing uncertainty and knowing things better through the use of data.
Buckle up, you just got started.
Great read Eldar, thank you.
I'm curious about your take on the ontology of data. How should we define it exactly? Can it exist without context?
Outstanding! To stand outside of data with skepticism and critique assertions. Bravo!